Immigrants from Bulgaria vs Menominee 3 or more Vehicles in Household
COMPARE
Immigrants from Bulgaria
Menominee
3 or more Vehicles in Household
3 or more Vehicles in Household Comparison
Immigrants from Bulgaria
Menominee
17.7%
3 OR MORE VEHICLES IN HOUSEHOLD
0.8/ 100
METRIC RATING
268th/ 347
METRIC RANK
17.2%
3 OR MORE VEHICLES IN HOUSEHOLD
0.2/ 100
METRIC RATING
286th/ 347
METRIC RANK
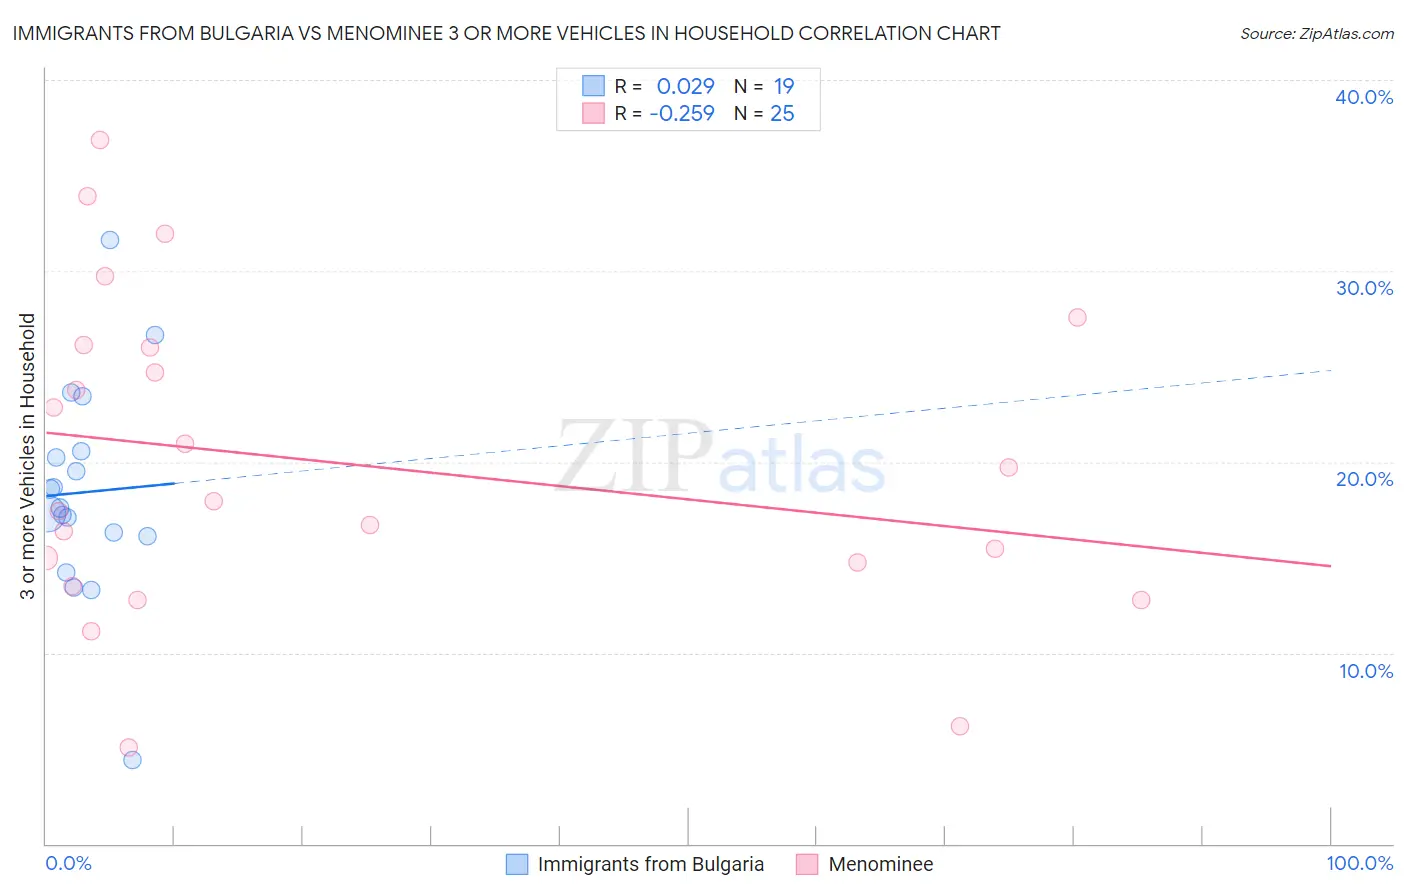
Immigrants from Bulgaria vs Menominee 3 or more Vehicles in Household Correlation Chart
The statistical analysis conducted on geographies consisting of 172,519,366 people shows no correlation between the proportion of Immigrants from Bulgaria and percentage of households with 3 or more vehicles available in the United States with a correlation coefficient (R) of 0.029 and weighted average of 17.7%. Similarly, the statistical analysis conducted on geographies consisting of 45,777,699 people shows a weak negative correlation between the proportion of Menominee and percentage of households with 3 or more vehicles available in the United States with a correlation coefficient (R) of -0.259 and weighted average of 17.2%, a difference of 3.1%.
3 or more Vehicles in Household Correlation Summary
| Measurement | Immigrants from Bulgaria | Menominee |
| Minimum | 4.4% | 5.1% |
| Maximum | 31.6% | 36.9% |
| Range | 27.3% | 31.8% |
| Mean | 18.4% | 20.0% |
| Median | 17.6% | 18.0% |
| Interquartile 25% (IQ1) | 16.1% | 14.1% |
| Interquartile 75% (IQ3) | 20.5% | 26.1% |
| Interquartile Range (IQR) | 4.4% | 12.0% |
| Standard Deviation (Sample) | 5.7% | 8.3% |
| Standard Deviation (Population) | 5.5% | 8.1% |
Demographics Similar to Immigrants from Bulgaria and Menominee by 3 or more Vehicles in Household
In terms of 3 or more vehicles in household, the demographic groups most similar to Immigrants from Bulgaria are Immigrants from Venezuela (17.7%, a difference of 0.010%), Immigrants from France (17.6%, a difference of 0.42%), Immigrants from Nepal (17.6%, a difference of 0.47%), South American (17.6%, a difference of 0.48%), and Immigrants from Africa (17.6%, a difference of 0.89%). Similarly, the demographic groups most similar to Menominee are Immigrants from Croatia (17.2%, a difference of 0.060%), Immigrants from Brazil (17.1%, a difference of 0.30%), Immigrants from Colombia (17.3%, a difference of 0.79%), Black/African American (17.3%, a difference of 0.91%), and Immigrants from Ireland (17.3%, a difference of 0.96%).
| Demographics | Rating | Rank | 3 or more Vehicles in Household |
| Immigrants | Venezuela | 0.8 /100 | #267 | Tragic 17.7% |
| Immigrants | Bulgaria | 0.8 /100 | #268 | Tragic 17.7% |
| Immigrants | France | 0.6 /100 | #269 | Tragic 17.6% |
| Immigrants | Nepal | 0.6 /100 | #270 | Tragic 17.6% |
| South Americans | 0.6 /100 | #271 | Tragic 17.6% |
| Immigrants | Africa | 0.5 /100 | #272 | Tragic 17.6% |
| Immigrants | Sudan | 0.5 /100 | #273 | Tragic 17.6% |
| Immigrants | Bosnia and Herzegovina | 0.5 /100 | #274 | Tragic 17.5% |
| Immigrants | Ukraine | 0.4 /100 | #275 | Tragic 17.5% |
| Okinawans | 0.4 /100 | #276 | Tragic 17.4% |
| Brazilians | 0.4 /100 | #277 | Tragic 17.4% |
| Immigrants | Bahamas | 0.3 /100 | #278 | Tragic 17.4% |
| Immigrants | Kazakhstan | 0.3 /100 | #279 | Tragic 17.4% |
| Immigrants | Eastern Europe | 0.3 /100 | #280 | Tragic 17.4% |
| Immigrants | Latvia | 0.3 /100 | #281 | Tragic 17.4% |
| Immigrants | Ireland | 0.3 /100 | #282 | Tragic 17.3% |
| Blacks/African Americans | 0.3 /100 | #283 | Tragic 17.3% |
| Immigrants | Colombia | 0.3 /100 | #284 | Tragic 17.3% |
| Immigrants | Croatia | 0.2 /100 | #285 | Tragic 17.2% |
| Menominee | 0.2 /100 | #286 | Tragic 17.2% |
| Immigrants | Brazil | 0.2 /100 | #287 | Tragic 17.1% |