Immigrants from Bulgaria vs Samoan 3 or more Vehicles in Household
COMPARE
Immigrants from Bulgaria
Samoan
3 or more Vehicles in Household
3 or more Vehicles in Household Comparison
Immigrants from Bulgaria
Samoans
17.7%
3 OR MORE VEHICLES IN HOUSEHOLD
0.8/ 100
METRIC RATING
268th/ 347
METRIC RANK
25.0%
3 OR MORE VEHICLES IN HOUSEHOLD
100.0/ 100
METRIC RATING
8th/ 347
METRIC RANK
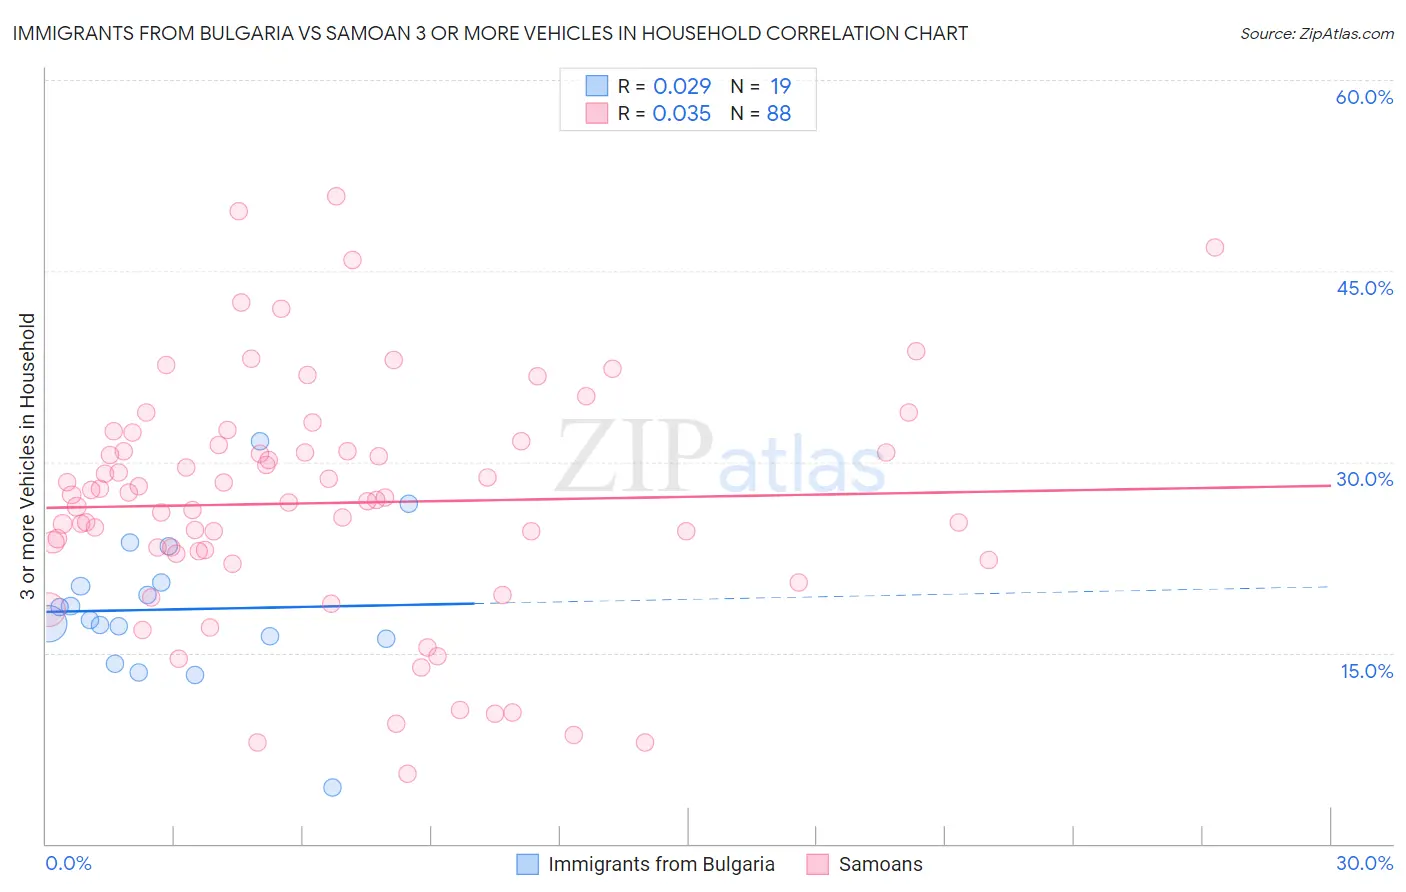
Immigrants from Bulgaria vs Samoan 3 or more Vehicles in Household Correlation Chart
The statistical analysis conducted on geographies consisting of 172,519,366 people shows no correlation between the proportion of Immigrants from Bulgaria and percentage of households with 3 or more vehicles available in the United States with a correlation coefficient (R) of 0.029 and weighted average of 17.7%. Similarly, the statistical analysis conducted on geographies consisting of 225,062,893 people shows no correlation between the proportion of Samoans and percentage of households with 3 or more vehicles available in the United States with a correlation coefficient (R) of 0.035 and weighted average of 25.0%, a difference of 40.9%.
3 or more Vehicles in Household Correlation Summary
| Measurement | Immigrants from Bulgaria | Samoan |
| Minimum | 4.4% | 5.5% |
| Maximum | 31.6% | 50.9% |
| Range | 27.3% | 45.4% |
| Mean | 18.4% | 26.8% |
| Median | 17.6% | 27.1% |
| Interquartile 25% (IQ1) | 16.1% | 22.9% |
| Interquartile 75% (IQ3) | 20.5% | 31.1% |
| Interquartile Range (IQR) | 4.4% | 8.2% |
| Standard Deviation (Sample) | 5.7% | 9.3% |
| Standard Deviation (Population) | 5.5% | 9.2% |
Similar Demographics by 3 or more Vehicles in Household
Demographics Similar to Immigrants from Bulgaria by 3 or more Vehicles in Household
In terms of 3 or more vehicles in household, the demographic groups most similar to Immigrants from Bulgaria are Immigrants from Venezuela (17.7%, a difference of 0.010%), Macedonian (17.7%, a difference of 0.070%), Immigrants from Panama (17.7%, a difference of 0.090%), Cambodian (17.8%, a difference of 0.23%), and Bermudan (17.8%, a difference of 0.26%).
| Demographics | Rating | Rank | 3 or more Vehicles in Household |
| Immigrants | Northern Africa | 0.9 /100 | #261 | Tragic 17.8% |
| Colombians | 0.9 /100 | #262 | Tragic 17.8% |
| Bermudans | 0.9 /100 | #263 | Tragic 17.8% |
| Cambodians | 0.9 /100 | #264 | Tragic 17.8% |
| Immigrants | Panama | 0.8 /100 | #265 | Tragic 17.7% |
| Macedonians | 0.8 /100 | #266 | Tragic 17.7% |
| Immigrants | Venezuela | 0.8 /100 | #267 | Tragic 17.7% |
| Immigrants | Bulgaria | 0.8 /100 | #268 | Tragic 17.7% |
| Immigrants | France | 0.6 /100 | #269 | Tragic 17.6% |
| Immigrants | Nepal | 0.6 /100 | #270 | Tragic 17.6% |
| South Americans | 0.6 /100 | #271 | Tragic 17.6% |
| Immigrants | Africa | 0.5 /100 | #272 | Tragic 17.6% |
| Immigrants | Sudan | 0.5 /100 | #273 | Tragic 17.6% |
| Immigrants | Bosnia and Herzegovina | 0.5 /100 | #274 | Tragic 17.5% |
| Immigrants | Ukraine | 0.4 /100 | #275 | Tragic 17.5% |
Demographics Similar to Samoans by 3 or more Vehicles in Household
In terms of 3 or more vehicles in household, the demographic groups most similar to Samoans are Native Hawaiian (24.9%, a difference of 0.10%), Nepalese (24.9%, a difference of 0.19%), Shoshone (24.9%, a difference of 0.29%), Danish (24.7%, a difference of 0.98%), and Mexican (24.7%, a difference of 1.1%).
| Demographics | Rating | Rank | 3 or more Vehicles in Household |
| Yakama | 100.0 /100 | #1 | Exceptional 31.0% |
| Spanish American Indians | 100.0 /100 | #2 | Exceptional 26.9% |
| Tongans | 100.0 /100 | #3 | Exceptional 26.5% |
| Arapaho | 100.0 /100 | #4 | Exceptional 26.4% |
| Puget Sound Salish | 100.0 /100 | #5 | Exceptional 26.4% |
| Immigrants | Fiji | 100.0 /100 | #6 | Exceptional 26.1% |
| Colville | 100.0 /100 | #7 | Exceptional 25.8% |
| Samoans | 100.0 /100 | #8 | Exceptional 25.0% |
| Native Hawaiians | 100.0 /100 | #9 | Exceptional 24.9% |
| Nepalese | 100.0 /100 | #10 | Exceptional 24.9% |
| Shoshone | 100.0 /100 | #11 | Exceptional 24.9% |
| Danes | 100.0 /100 | #12 | Exceptional 24.7% |
| Mexicans | 100.0 /100 | #13 | Exceptional 24.7% |
| Immigrants | Mexico | 100.0 /100 | #14 | Exceptional 24.6% |
| Hawaiians | 100.0 /100 | #15 | Exceptional 24.3% |