Cuban vs Immigrants from Poland 3 or more Vehicles in Household
COMPARE
Cuban
Immigrants from Poland
3 or more Vehicles in Household
3 or more Vehicles in Household Comparison
Cubans
Immigrants from Poland
19.3%
3 OR MORE VEHICLES IN HOUSEHOLD
36.6/ 100
METRIC RATING
182nd/ 347
METRIC RANK
18.6%
3 OR MORE VEHICLES IN HOUSEHOLD
7.5/ 100
METRIC RATING
221st/ 347
METRIC RANK
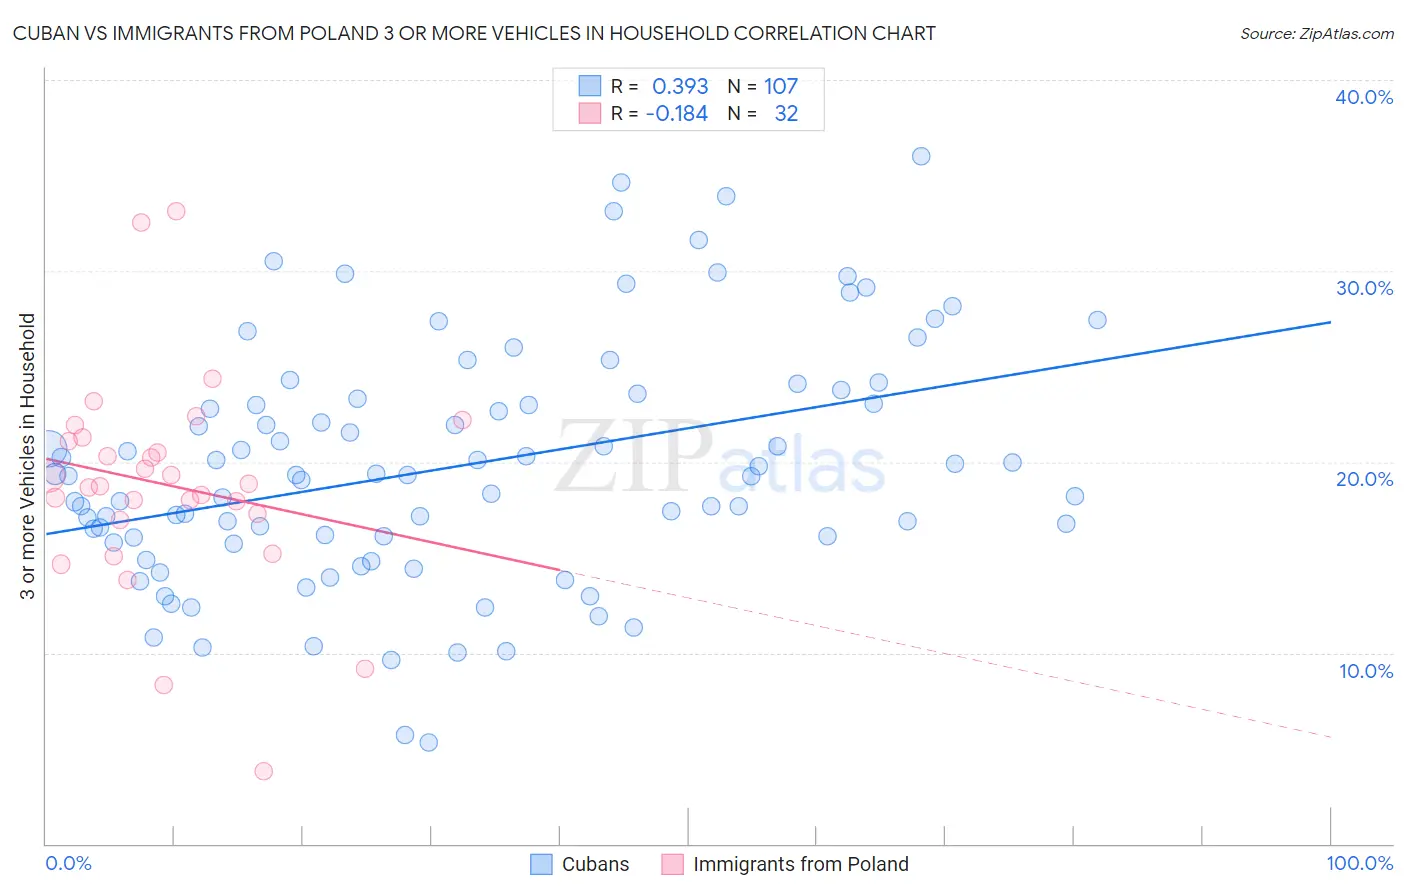
Cuban vs Immigrants from Poland 3 or more Vehicles in Household Correlation Chart
The statistical analysis conducted on geographies consisting of 448,802,841 people shows a mild positive correlation between the proportion of Cubans and percentage of households with 3 or more vehicles available in the United States with a correlation coefficient (R) of 0.393 and weighted average of 19.3%. Similarly, the statistical analysis conducted on geographies consisting of 304,731,133 people shows a poor negative correlation between the proportion of Immigrants from Poland and percentage of households with 3 or more vehicles available in the United States with a correlation coefficient (R) of -0.184 and weighted average of 18.6%, a difference of 3.9%.
3 or more Vehicles in Household Correlation Summary
| Measurement | Cuban | Immigrants from Poland |
| Minimum | 5.3% | 3.8% |
| Maximum | 36.0% | 33.1% |
| Range | 30.7% | 29.3% |
| Mean | 19.8% | 18.8% |
| Median | 19.3% | 18.8% |
| Interquartile 25% (IQ1) | 16.0% | 17.1% |
| Interquartile 75% (IQ3) | 23.3% | 21.2% |
| Interquartile Range (IQR) | 7.3% | 4.0% |
| Standard Deviation (Sample) | 6.3% | 5.7% |
| Standard Deviation (Population) | 6.2% | 5.6% |
Similar Demographics by 3 or more Vehicles in Household
Demographics Similar to Cubans by 3 or more Vehicles in Household
In terms of 3 or more vehicles in household, the demographic groups most similar to Cubans are Romanian (19.3%, a difference of 0.040%), Cajun (19.3%, a difference of 0.050%), South African (19.3%, a difference of 0.070%), Latvian (19.3%, a difference of 0.070%), and Immigrants from South Central Asia (19.3%, a difference of 0.19%).
| Demographics | Rating | Rank | 3 or more Vehicles in Household |
| Syrians | 47.0 /100 | #175 | Average 19.5% |
| Iroquois | 46.0 /100 | #176 | Average 19.4% |
| Immigrants | Peru | 41.1 /100 | #177 | Average 19.4% |
| Immigrants | Syria | 40.3 /100 | #178 | Average 19.4% |
| Immigrants | South Central Asia | 38.9 /100 | #179 | Fair 19.3% |
| South Africans | 37.5 /100 | #180 | Fair 19.3% |
| Romanians | 37.1 /100 | #181 | Fair 19.3% |
| Cubans | 36.6 /100 | #182 | Fair 19.3% |
| Cajuns | 36.0 /100 | #183 | Fair 19.3% |
| Latvians | 35.7 /100 | #184 | Fair 19.3% |
| Immigrants | Sri Lanka | 30.7 /100 | #185 | Fair 19.2% |
| Immigrants | Sweden | 29.0 /100 | #186 | Fair 19.2% |
| Immigrants | Hong Kong | 28.3 /100 | #187 | Fair 19.2% |
| Immigrants | Kuwait | 26.1 /100 | #188 | Fair 19.1% |
| Indians (Asian) | 26.0 /100 | #189 | Fair 19.1% |
Demographics Similar to Immigrants from Poland by 3 or more Vehicles in Household
In terms of 3 or more vehicles in household, the demographic groups most similar to Immigrants from Poland are Belizean (18.6%, a difference of 0.050%), Nigerian (18.6%, a difference of 0.090%), Immigrants from Armenia (18.6%, a difference of 0.29%), Immigrants from Portugal (18.6%, a difference of 0.37%), and Immigrants from Czechoslovakia (18.5%, a difference of 0.52%).
| Demographics | Rating | Rank | 3 or more Vehicles in Household |
| Immigrants | Sierra Leone | 10.8 /100 | #214 | Poor 18.7% |
| Eastern Europeans | 10.6 /100 | #215 | Poor 18.7% |
| Immigrants | Nigeria | 10.3 /100 | #216 | Poor 18.7% |
| Immigrants | Italy | 10.2 /100 | #217 | Poor 18.7% |
| Immigrants | Portugal | 8.9 /100 | #218 | Tragic 18.6% |
| Immigrants | Armenia | 8.6 /100 | #219 | Tragic 18.6% |
| Nigerians | 7.9 /100 | #220 | Tragic 18.6% |
| Immigrants | Poland | 7.5 /100 | #221 | Tragic 18.6% |
| Belizeans | 7.3 /100 | #222 | Tragic 18.6% |
| Immigrants | Czechoslovakia | 5.9 /100 | #223 | Tragic 18.5% |
| Immigrants | Argentina | 5.6 /100 | #224 | Tragic 18.5% |
| Immigrants | Lithuania | 5.6 /100 | #225 | Tragic 18.5% |
| Immigrants | Hungary | 5.5 /100 | #226 | Tragic 18.5% |
| Immigrants | Singapore | 5.4 /100 | #227 | Tragic 18.4% |
| Turks | 5.4 /100 | #228 | Tragic 18.4% |