Nepalese vs Panamanian 2 or more Vehicles in Household
COMPARE
Nepalese
Panamanian
2 or more Vehicles in Household
2 or more Vehicles in Household Comparison
Nepalese
Panamanians
61.4%
2 OR MORE VEHICLES IN HOUSEHOLD
100.0/ 100
METRIC RATING
15th/ 347
METRIC RANK
53.5%
2 OR MORE VEHICLES IN HOUSEHOLD
3.4/ 100
METRIC RATING
231st/ 347
METRIC RANK
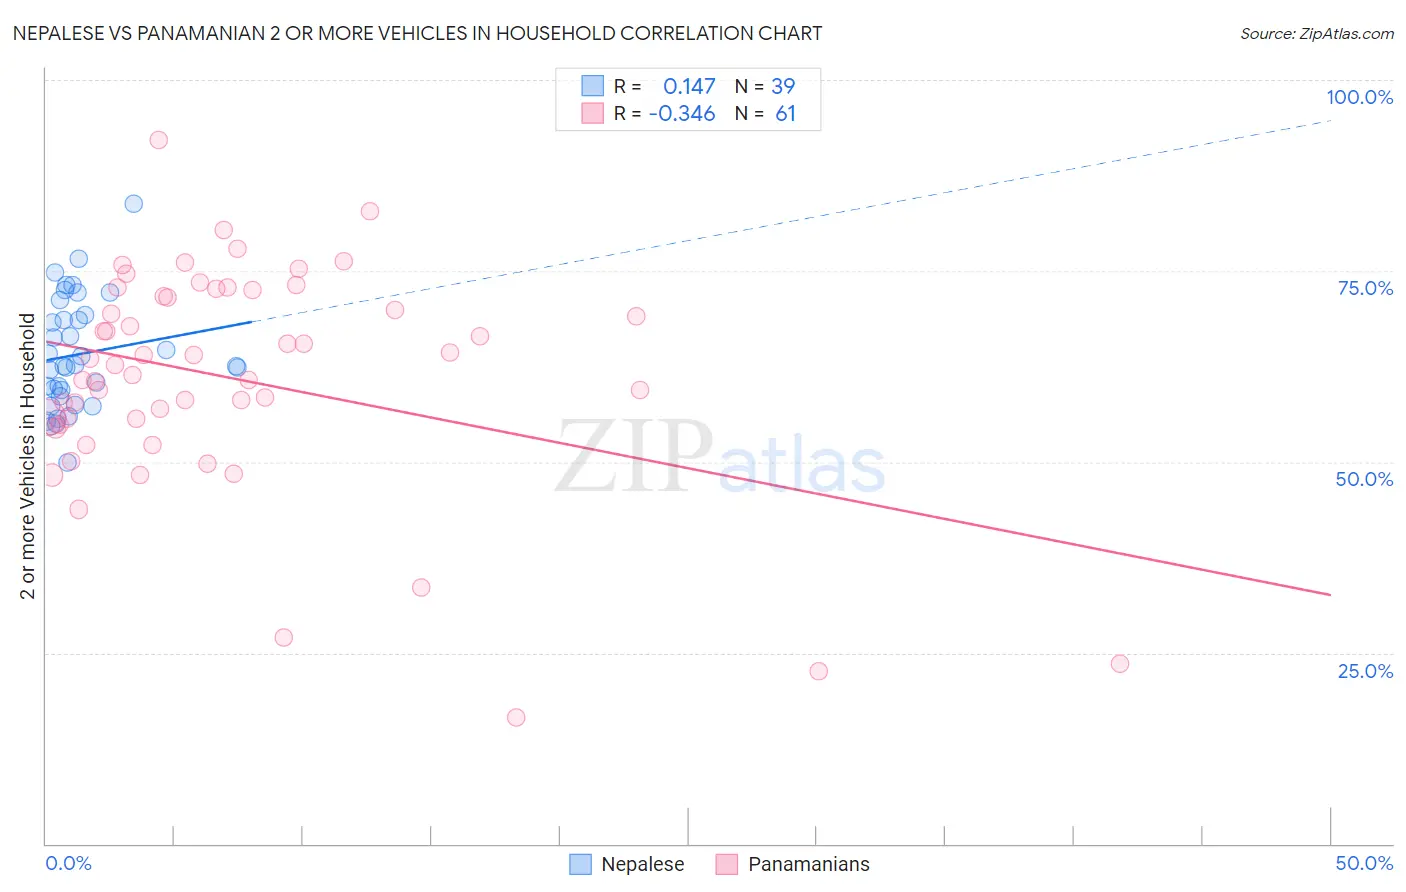
Nepalese vs Panamanian 2 or more Vehicles in Household Correlation Chart
The statistical analysis conducted on geographies consisting of 24,483,296 people shows a poor positive correlation between the proportion of Nepalese and percentage of households with 2 or more vehicles available in the United States with a correlation coefficient (R) of 0.147 and weighted average of 61.4%. Similarly, the statistical analysis conducted on geographies consisting of 281,077,376 people shows a mild negative correlation between the proportion of Panamanians and percentage of households with 2 or more vehicles available in the United States with a correlation coefficient (R) of -0.346 and weighted average of 53.5%, a difference of 14.8%.
2 or more Vehicles in Household Correlation Summary
| Measurement | Nepalese | Panamanian |
| Minimum | 49.8% | 16.5% |
| Maximum | 83.8% | 92.2% |
| Range | 33.9% | 75.7% |
| Mean | 64.1% | 61.0% |
| Median | 62.5% | 62.7% |
| Interquartile 25% (IQ1) | 58.6% | 55.3% |
| Interquartile 75% (IQ3) | 69.3% | 72.1% |
| Interquartile Range (IQR) | 10.7% | 16.8% |
| Standard Deviation (Sample) | 7.3% | 14.6% |
| Standard Deviation (Population) | 7.2% | 14.5% |
Similar Demographics by 2 or more Vehicles in Household
Demographics Similar to Nepalese by 2 or more Vehicles in Household
In terms of 2 or more vehicles in household, the demographic groups most similar to Nepalese are Native Hawaiian (61.4%, a difference of 0.020%), Czech (61.5%, a difference of 0.090%), Basque (61.4%, a difference of 0.090%), European (61.4%, a difference of 0.10%), and Samoan (61.5%, a difference of 0.14%).
| Demographics | Rating | Rank | 2 or more Vehicles in Household |
| English | 100.0 /100 | #8 | Exceptional 61.9% |
| Swedes | 100.0 /100 | #9 | Exceptional 61.8% |
| Mexicans | 100.0 /100 | #10 | Exceptional 61.7% |
| Dutch | 100.0 /100 | #11 | Exceptional 61.6% |
| Germans | 100.0 /100 | #12 | Exceptional 61.6% |
| Samoans | 100.0 /100 | #13 | Exceptional 61.5% |
| Czechs | 100.0 /100 | #14 | Exceptional 61.5% |
| Nepalese | 100.0 /100 | #15 | Exceptional 61.4% |
| Native Hawaiians | 100.0 /100 | #16 | Exceptional 61.4% |
| Basques | 100.0 /100 | #17 | Exceptional 61.4% |
| Europeans | 100.0 /100 | #18 | Exceptional 61.4% |
| Scottish | 100.0 /100 | #19 | Exceptional 61.2% |
| Sri Lankans | 100.0 /100 | #20 | Exceptional 61.0% |
| Koreans | 100.0 /100 | #21 | Exceptional 61.0% |
| Swiss | 100.0 /100 | #22 | Exceptional 61.0% |
Demographics Similar to Panamanians by 2 or more Vehicles in Household
In terms of 2 or more vehicles in household, the demographic groups most similar to Panamanians are Immigrants from Nepal (53.5%, a difference of 0.050%), Immigrants from Guatemala (53.5%, a difference of 0.070%), Ugandan (53.5%, a difference of 0.080%), Immigrants from Turkey (53.6%, a difference of 0.11%), and Alaska Native (53.6%, a difference of 0.13%).
| Demographics | Rating | Rank | 2 or more Vehicles in Household |
| Brazilians | 5.3 /100 | #224 | Tragic 53.8% |
| Immigrants | Egypt | 5.2 /100 | #225 | Tragic 53.8% |
| Immigrants | Eastern Africa | 5.1 /100 | #226 | Tragic 53.7% |
| Sudanese | 4.1 /100 | #227 | Tragic 53.6% |
| Alaska Natives | 3.9 /100 | #228 | Tragic 53.6% |
| Immigrants | Turkey | 3.8 /100 | #229 | Tragic 53.6% |
| Immigrants | Nepal | 3.6 /100 | #230 | Tragic 53.5% |
| Panamanians | 3.4 /100 | #231 | Tragic 53.5% |
| Immigrants | Guatemala | 3.2 /100 | #232 | Tragic 53.5% |
| Ugandans | 3.2 /100 | #233 | Tragic 53.5% |
| Immigrants | Switzerland | 3.0 /100 | #234 | Tragic 53.4% |
| Immigrants | Middle Africa | 3.0 /100 | #235 | Tragic 53.4% |
| Indonesians | 2.7 /100 | #236 | Tragic 53.4% |
| Macedonians | 2.4 /100 | #237 | Tragic 53.3% |
| Immigrants | Armenia | 2.3 /100 | #238 | Tragic 53.3% |