Hungarian vs Celtic 3 or more Vehicles in Household
COMPARE
Hungarian
Celtic
3 or more Vehicles in Household
3 or more Vehicles in Household Comparison
Hungarians
Celtics
19.8%
3 OR MORE VEHICLES IN HOUSEHOLD
70.5/ 100
METRIC RATING
157th/ 347
METRIC RANK
21.7%
3 OR MORE VEHICLES IN HOUSEHOLD
99.7/ 100
METRIC RATING
81st/ 347
METRIC RANK
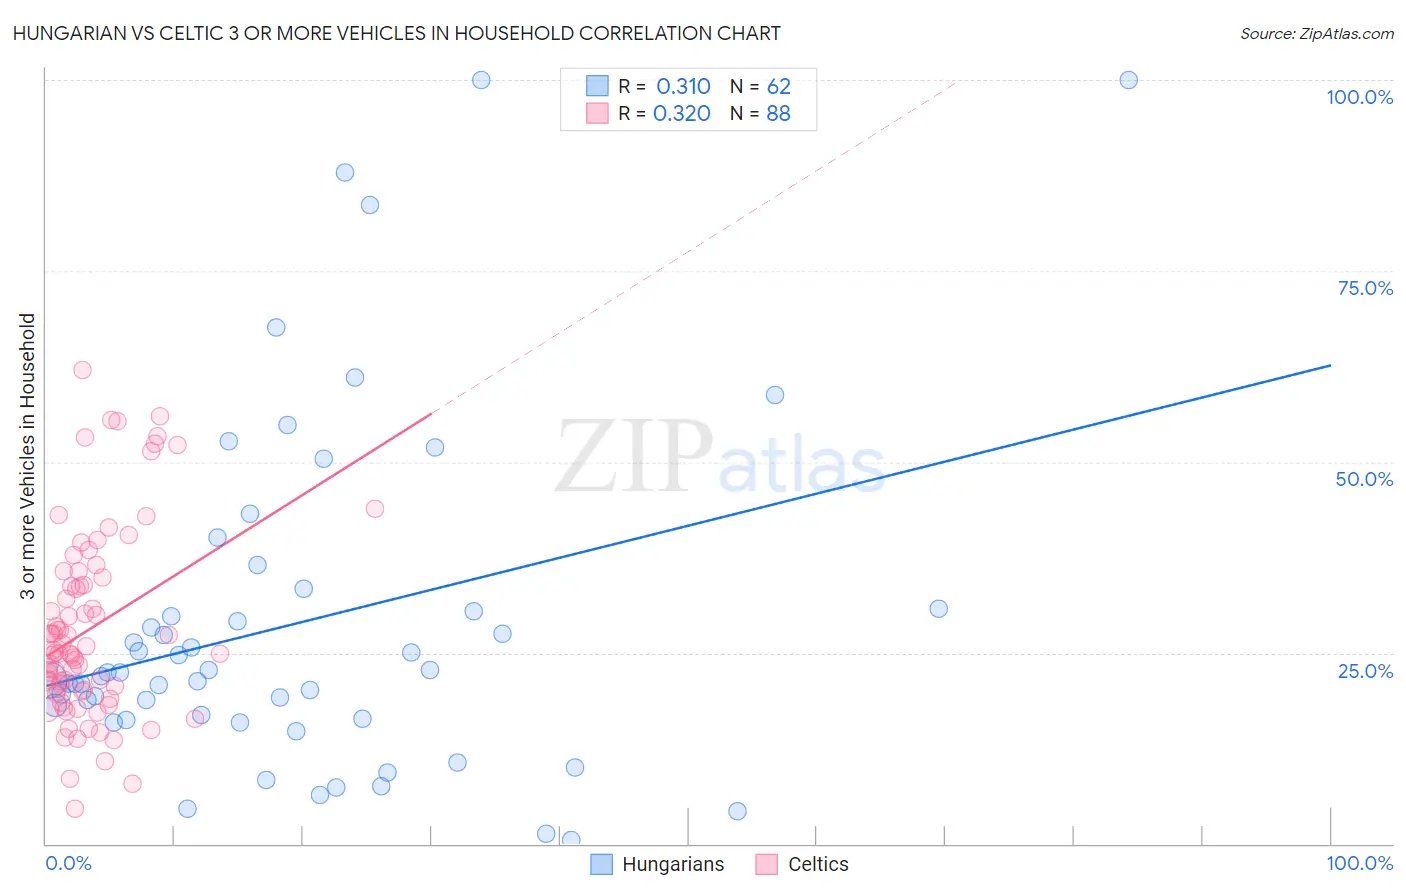
Hungarian vs Celtic 3 or more Vehicles in Household Correlation Chart
The statistical analysis conducted on geographies consisting of 485,698,849 people shows a mild positive correlation between the proportion of Hungarians and percentage of households with 3 or more vehicles available in the United States with a correlation coefficient (R) of 0.310 and weighted average of 19.8%. Similarly, the statistical analysis conducted on geographies consisting of 168,856,114 people shows a mild positive correlation between the proportion of Celtics and percentage of households with 3 or more vehicles available in the United States with a correlation coefficient (R) of 0.320 and weighted average of 21.7%, a difference of 9.3%.
3 or more Vehicles in Household Correlation Summary
| Measurement | Hungarian | Celtic |
| Minimum | 0.54% | 4.5% |
| Maximum | 100.0% | 62.1% |
| Range | 99.5% | 57.5% |
| Mean | 28.9% | 28.1% |
| Median | 22.2% | 25.0% |
| Interquartile 25% (IQ1) | 16.4% | 20.0% |
| Interquartile 75% (IQ3) | 30.8% | 34.4% |
| Interquartile Range (IQR) | 14.4% | 14.4% |
| Standard Deviation (Sample) | 22.4% | 12.3% |
| Standard Deviation (Population) | 22.2% | 12.2% |
Similar Demographics by 3 or more Vehicles in Household
Demographics Similar to Hungarians by 3 or more Vehicles in Household
In terms of 3 or more vehicles in household, the demographic groups most similar to Hungarians are Thai (19.8%, a difference of 0.050%), Armenian (19.8%, a difference of 0.15%), Immigrants from Pakistan (19.8%, a difference of 0.21%), Tlingit-Haida (19.9%, a difference of 0.26%), and Immigrants from Lebanon (19.8%, a difference of 0.26%).
| Demographics | Rating | Rank | 3 or more Vehicles in Household |
| Immigrants | Immigrants | 80.8 /100 | #150 | Excellent 20.0% |
| Taiwanese | 80.6 /100 | #151 | Excellent 20.0% |
| Lebanese | 79.8 /100 | #152 | Good 20.0% |
| Yuman | 75.6 /100 | #153 | Good 19.9% |
| Immigrants | Jordan | 75.0 /100 | #154 | Good 19.9% |
| Tlingit-Haida | 73.4 /100 | #155 | Good 19.9% |
| Thais | 71.1 /100 | #156 | Good 19.8% |
| Hungarians | 70.5 /100 | #157 | Good 19.8% |
| Armenians | 68.8 /100 | #158 | Good 19.8% |
| Immigrants | Pakistan | 68.2 /100 | #159 | Good 19.8% |
| Immigrants | Lebanon | 67.6 /100 | #160 | Good 19.8% |
| Immigrants | Guatemala | 65.6 /100 | #161 | Good 19.7% |
| Estonians | 63.2 /100 | #162 | Good 19.7% |
| Chileans | 63.0 /100 | #163 | Good 19.7% |
| Yugoslavians | 62.9 /100 | #164 | Good 19.7% |
Demographics Similar to Celtics by 3 or more Vehicles in Household
In terms of 3 or more vehicles in household, the demographic groups most similar to Celtics are Afghan (21.7%, a difference of 0.070%), Czechoslovakian (21.7%, a difference of 0.28%), Assyrian/Chaldean/Syriac (21.7%, a difference of 0.28%), Irish (21.8%, a difference of 0.41%), and Nonimmigrants (21.8%, a difference of 0.48%).
| Demographics | Rating | Rank | 3 or more Vehicles in Household |
| Immigrants | Oceania | 99.8 /100 | #74 | Exceptional 21.8% |
| Japanese | 99.8 /100 | #75 | Exceptional 21.8% |
| Immigrants | Nonimmigrants | 99.8 /100 | #76 | Exceptional 21.8% |
| Irish | 99.8 /100 | #77 | Exceptional 21.8% |
| Czechoslovakians | 99.8 /100 | #78 | Exceptional 21.7% |
| Assyrians/Chaldeans/Syriacs | 99.8 /100 | #79 | Exceptional 21.7% |
| Afghans | 99.7 /100 | #80 | Exceptional 21.7% |
| Celtics | 99.7 /100 | #81 | Exceptional 21.7% |
| Immigrants | El Salvador | 99.6 /100 | #82 | Exceptional 21.5% |
| Chippewa | 99.6 /100 | #83 | Exceptional 21.5% |
| Icelanders | 99.6 /100 | #84 | Exceptional 21.5% |
| Laotians | 99.6 /100 | #85 | Exceptional 21.5% |
| Delaware | 99.6 /100 | #86 | Exceptional 21.5% |
| Immigrants | Azores | 99.5 /100 | #87 | Exceptional 21.5% |
| French | 99.4 /100 | #88 | Exceptional 21.4% |