Blackfeet vs Celtic 3 or more Vehicles in Household
COMPARE
Blackfeet
Celtic
3 or more Vehicles in Household
3 or more Vehicles in Household Comparison
Blackfeet
Celtics
20.9%
3 OR MORE VEHICLES IN HOUSEHOLD
97.9/ 100
METRIC RATING
101st/ 347
METRIC RANK
21.7%
3 OR MORE VEHICLES IN HOUSEHOLD
99.7/ 100
METRIC RATING
81st/ 347
METRIC RANK
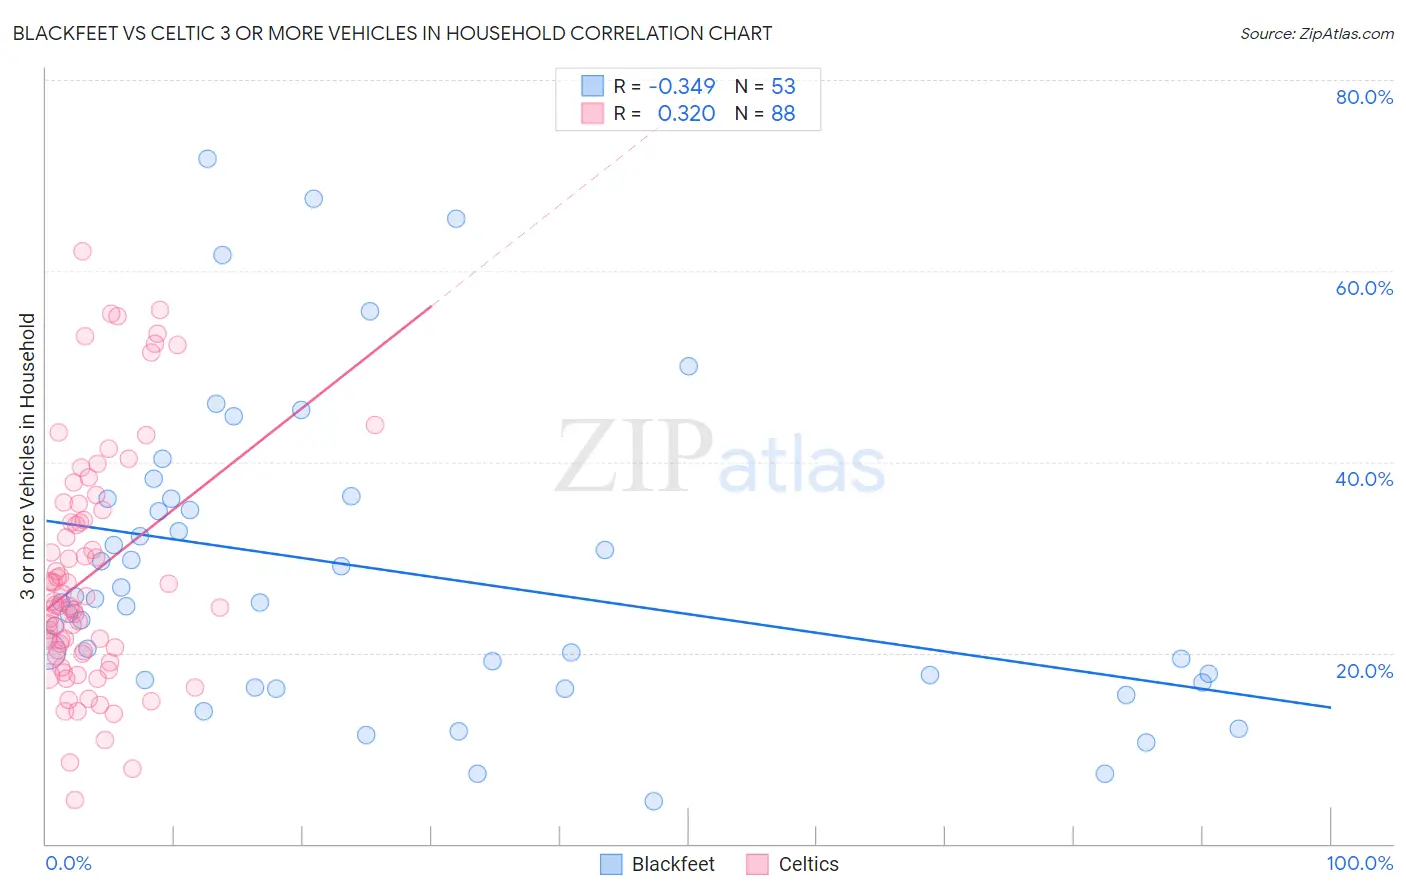
Blackfeet vs Celtic 3 or more Vehicles in Household Correlation Chart
The statistical analysis conducted on geographies consisting of 309,447,787 people shows a mild negative correlation between the proportion of Blackfeet and percentage of households with 3 or more vehicles available in the United States with a correlation coefficient (R) of -0.349 and weighted average of 20.9%. Similarly, the statistical analysis conducted on geographies consisting of 168,856,114 people shows a mild positive correlation between the proportion of Celtics and percentage of households with 3 or more vehicles available in the United States with a correlation coefficient (R) of 0.320 and weighted average of 21.7%, a difference of 3.6%.
3 or more Vehicles in Household Correlation Summary
| Measurement | Blackfeet | Celtic |
| Minimum | 4.5% | 4.5% |
| Maximum | 71.7% | 62.1% |
| Range | 67.2% | 57.5% |
| Mean | 28.6% | 28.1% |
| Median | 25.3% | 25.0% |
| Interquartile 25% (IQ1) | 17.1% | 20.0% |
| Interquartile 75% (IQ3) | 36.1% | 34.4% |
| Interquartile Range (IQR) | 19.1% | 14.4% |
| Standard Deviation (Sample) | 15.8% | 12.3% |
| Standard Deviation (Population) | 15.6% | 12.2% |
Demographics Similar to Blackfeet and Celtics by 3 or more Vehicles in Household
In terms of 3 or more vehicles in household, the demographic groups most similar to Blackfeet are Comanche (21.0%, a difference of 0.31%), Hmong (21.0%, a difference of 0.35%), Alaska Native (21.0%, a difference of 0.35%), Canadian (21.0%, a difference of 0.41%), and Cree (21.0%, a difference of 0.52%). Similarly, the demographic groups most similar to Celtics are Immigrants from El Salvador (21.5%, a difference of 0.64%), Chippewa (21.5%, a difference of 0.67%), Icelander (21.5%, a difference of 0.72%), Laotian (21.5%, a difference of 0.74%), and Delaware (21.5%, a difference of 0.82%).
| Demographics | Rating | Rank | 3 or more Vehicles in Household |
| Celtics | 99.7 /100 | #81 | Exceptional 21.7% |
| Immigrants | El Salvador | 99.6 /100 | #82 | Exceptional 21.5% |
| Chippewa | 99.6 /100 | #83 | Exceptional 21.5% |
| Icelanders | 99.6 /100 | #84 | Exceptional 21.5% |
| Laotians | 99.6 /100 | #85 | Exceptional 21.5% |
| Delaware | 99.6 /100 | #86 | Exceptional 21.5% |
| Immigrants | Azores | 99.5 /100 | #87 | Exceptional 21.5% |
| French | 99.4 /100 | #88 | Exceptional 21.4% |
| Marshallese | 99.2 /100 | #89 | Exceptional 21.3% |
| Immigrants | Afghanistan | 99.1 /100 | #90 | Exceptional 21.2% |
| Belgians | 98.9 /100 | #91 | Exceptional 21.2% |
| Apache | 98.9 /100 | #92 | Exceptional 21.2% |
| Immigrants | Indonesia | 98.8 /100 | #93 | Exceptional 21.1% |
| Immigrants | Cambodia | 98.6 /100 | #94 | Exceptional 21.1% |
| Pakistanis | 98.5 /100 | #95 | Exceptional 21.0% |
| Cree | 98.4 /100 | #96 | Exceptional 21.0% |
| Canadians | 98.3 /100 | #97 | Exceptional 21.0% |
| Hmong | 98.2 /100 | #98 | Exceptional 21.0% |
| Alaska Natives | 98.2 /100 | #99 | Exceptional 21.0% |
| Comanche | 98.2 /100 | #100 | Exceptional 21.0% |
| Blackfeet | 97.9 /100 | #101 | Exceptional 20.9% |