Hungarian vs Immigrants from Panama 3 or more Vehicles in Household
COMPARE
Hungarian
Immigrants from Panama
3 or more Vehicles in Household
3 or more Vehicles in Household Comparison
Hungarians
Immigrants from Panama
19.8%
3 OR MORE VEHICLES IN HOUSEHOLD
70.5/ 100
METRIC RATING
157th/ 347
METRIC RANK
17.7%
3 OR MORE VEHICLES IN HOUSEHOLD
0.8/ 100
METRIC RATING
265th/ 347
METRIC RANK
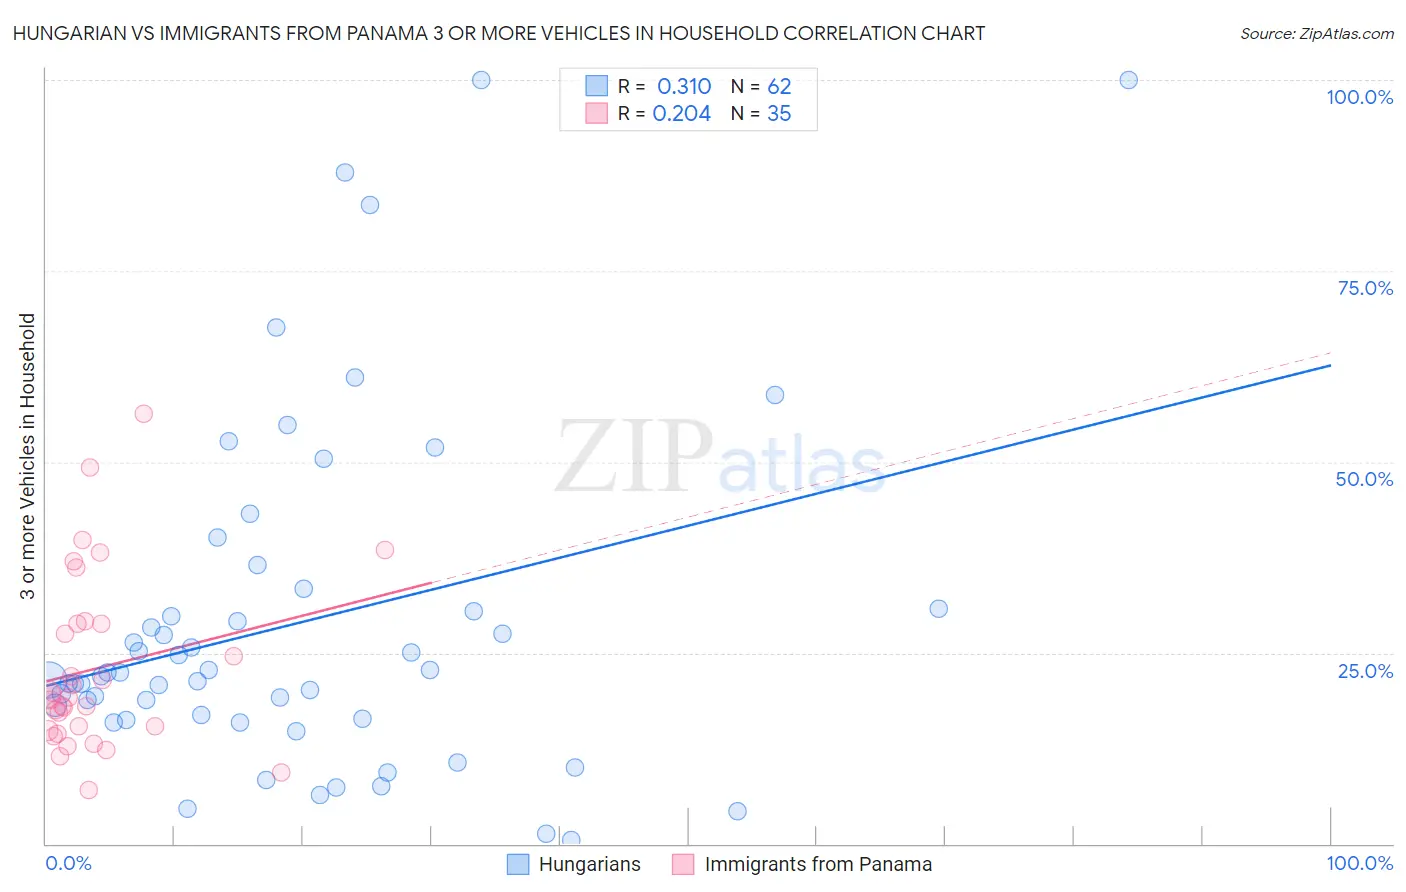
Hungarian vs Immigrants from Panama 3 or more Vehicles in Household Correlation Chart
The statistical analysis conducted on geographies consisting of 485,698,849 people shows a mild positive correlation between the proportion of Hungarians and percentage of households with 3 or more vehicles available in the United States with a correlation coefficient (R) of 0.310 and weighted average of 19.8%. Similarly, the statistical analysis conducted on geographies consisting of 221,149,487 people shows a weak positive correlation between the proportion of Immigrants from Panama and percentage of households with 3 or more vehicles available in the United States with a correlation coefficient (R) of 0.204 and weighted average of 17.7%, a difference of 11.8%.
3 or more Vehicles in Household Correlation Summary
| Measurement | Hungarian | Immigrants from Panama |
| Minimum | 0.54% | 7.1% |
| Maximum | 100.0% | 56.2% |
| Range | 99.5% | 49.1% |
| Mean | 28.9% | 23.0% |
| Median | 22.2% | 19.1% |
| Interquartile 25% (IQ1) | 16.4% | 14.8% |
| Interquartile 75% (IQ3) | 30.8% | 28.9% |
| Interquartile Range (IQR) | 14.4% | 14.1% |
| Standard Deviation (Sample) | 22.4% | 11.5% |
| Standard Deviation (Population) | 22.2% | 11.3% |
Similar Demographics by 3 or more Vehicles in Household
Demographics Similar to Hungarians by 3 or more Vehicles in Household
In terms of 3 or more vehicles in household, the demographic groups most similar to Hungarians are Thai (19.8%, a difference of 0.050%), Armenian (19.8%, a difference of 0.15%), Immigrants from Pakistan (19.8%, a difference of 0.21%), Tlingit-Haida (19.9%, a difference of 0.26%), and Immigrants from Lebanon (19.8%, a difference of 0.26%).
| Demographics | Rating | Rank | 3 or more Vehicles in Household |
| Immigrants | Immigrants | 80.8 /100 | #150 | Excellent 20.0% |
| Taiwanese | 80.6 /100 | #151 | Excellent 20.0% |
| Lebanese | 79.8 /100 | #152 | Good 20.0% |
| Yuman | 75.6 /100 | #153 | Good 19.9% |
| Immigrants | Jordan | 75.0 /100 | #154 | Good 19.9% |
| Tlingit-Haida | 73.4 /100 | #155 | Good 19.9% |
| Thais | 71.1 /100 | #156 | Good 19.8% |
| Hungarians | 70.5 /100 | #157 | Good 19.8% |
| Armenians | 68.8 /100 | #158 | Good 19.8% |
| Immigrants | Pakistan | 68.2 /100 | #159 | Good 19.8% |
| Immigrants | Lebanon | 67.6 /100 | #160 | Good 19.8% |
| Immigrants | Guatemala | 65.6 /100 | #161 | Good 19.7% |
| Estonians | 63.2 /100 | #162 | Good 19.7% |
| Chileans | 63.0 /100 | #163 | Good 19.7% |
| Yugoslavians | 62.9 /100 | #164 | Good 19.7% |
Demographics Similar to Immigrants from Panama by 3 or more Vehicles in Household
In terms of 3 or more vehicles in household, the demographic groups most similar to Immigrants from Panama are Macedonian (17.7%, a difference of 0.020%), Immigrants from Venezuela (17.7%, a difference of 0.080%), Immigrants from Bulgaria (17.7%, a difference of 0.090%), Cambodian (17.8%, a difference of 0.14%), and Bermudan (17.8%, a difference of 0.16%).
| Demographics | Rating | Rank | 3 or more Vehicles in Household |
| Sudanese | 1.1 /100 | #258 | Tragic 17.8% |
| Uruguayans | 1.0 /100 | #259 | Tragic 17.8% |
| Ugandans | 0.9 /100 | #260 | Tragic 17.8% |
| Immigrants | Northern Africa | 0.9 /100 | #261 | Tragic 17.8% |
| Colombians | 0.9 /100 | #262 | Tragic 17.8% |
| Bermudans | 0.9 /100 | #263 | Tragic 17.8% |
| Cambodians | 0.9 /100 | #264 | Tragic 17.8% |
| Immigrants | Panama | 0.8 /100 | #265 | Tragic 17.7% |
| Macedonians | 0.8 /100 | #266 | Tragic 17.7% |
| Immigrants | Venezuela | 0.8 /100 | #267 | Tragic 17.7% |
| Immigrants | Bulgaria | 0.8 /100 | #268 | Tragic 17.7% |
| Immigrants | France | 0.6 /100 | #269 | Tragic 17.6% |
| Immigrants | Nepal | 0.6 /100 | #270 | Tragic 17.6% |
| South Americans | 0.6 /100 | #271 | Tragic 17.6% |
| Immigrants | Africa | 0.5 /100 | #272 | Tragic 17.6% |