Spanish American vs Celtic 3 or more Vehicles in Household
COMPARE
Spanish American
Celtic
3 or more Vehicles in Household
3 or more Vehicles in Household Comparison
Spanish Americans
Celtics
23.0%
3 OR MORE VEHICLES IN HOUSEHOLD
100.0/ 100
METRIC RATING
33rd/ 347
METRIC RANK
21.7%
3 OR MORE VEHICLES IN HOUSEHOLD
99.7/ 100
METRIC RATING
81st/ 347
METRIC RANK
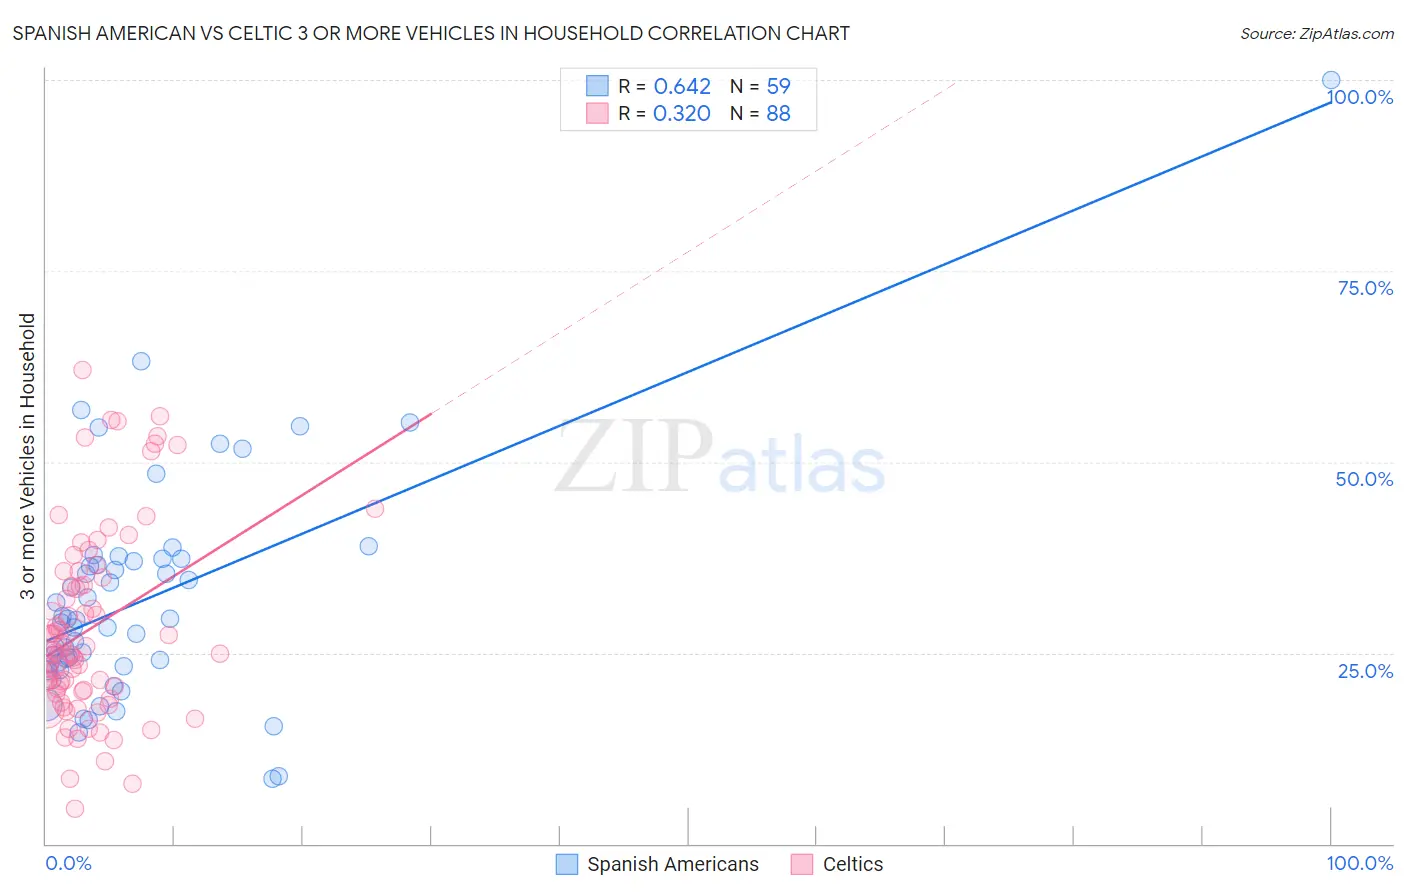
Spanish American vs Celtic 3 or more Vehicles in Household Correlation Chart
The statistical analysis conducted on geographies consisting of 103,168,496 people shows a significant positive correlation between the proportion of Spanish Americans and percentage of households with 3 or more vehicles available in the United States with a correlation coefficient (R) of 0.642 and weighted average of 23.0%. Similarly, the statistical analysis conducted on geographies consisting of 168,856,114 people shows a mild positive correlation between the proportion of Celtics and percentage of households with 3 or more vehicles available in the United States with a correlation coefficient (R) of 0.320 and weighted average of 21.7%, a difference of 6.2%.
3 or more Vehicles in Household Correlation Summary
| Measurement | Spanish American | Celtic |
| Minimum | 8.5% | 4.5% |
| Maximum | 100.0% | 62.1% |
| Range | 91.5% | 57.5% |
| Mean | 32.0% | 28.1% |
| Median | 29.3% | 25.0% |
| Interquartile 25% (IQ1) | 23.3% | 20.0% |
| Interquartile 75% (IQ3) | 37.2% | 34.4% |
| Interquartile Range (IQR) | 13.9% | 14.4% |
| Standard Deviation (Sample) | 15.1% | 12.3% |
| Standard Deviation (Population) | 14.9% | 12.2% |
Similar Demographics by 3 or more Vehicles in Household
Demographics Similar to Spanish Americans by 3 or more Vehicles in Household
In terms of 3 or more vehicles in household, the demographic groups most similar to Spanish Americans are Swiss (23.0%, a difference of 0.050%), Pueblo (23.0%, a difference of 0.060%), Choctaw (23.0%, a difference of 0.070%), Cherokee (23.0%, a difference of 0.11%), and Swedish (23.0%, a difference of 0.14%).
| Demographics | Rating | Rank | 3 or more Vehicles in Household |
| Mexican American Indians | 100.0 /100 | #26 | Exceptional 23.3% |
| Guamanians/Chamorros | 100.0 /100 | #27 | Exceptional 23.2% |
| Lumbee | 100.0 /100 | #28 | Exceptional 23.1% |
| Spanish | 100.0 /100 | #29 | Exceptional 23.1% |
| Immigrants | South Eastern Asia | 100.0 /100 | #30 | Exceptional 23.1% |
| English | 100.0 /100 | #31 | Exceptional 23.1% |
| Pueblo | 100.0 /100 | #32 | Exceptional 23.0% |
| Spanish Americans | 100.0 /100 | #33 | Exceptional 23.0% |
| Swiss | 100.0 /100 | #34 | Exceptional 23.0% |
| Choctaw | 100.0 /100 | #35 | Exceptional 23.0% |
| Cherokee | 100.0 /100 | #36 | Exceptional 23.0% |
| Swedes | 100.0 /100 | #37 | Exceptional 23.0% |
| Dutch | 100.0 /100 | #38 | Exceptional 22.9% |
| Yaqui | 100.0 /100 | #39 | Exceptional 22.9% |
| Europeans | 100.0 /100 | #40 | Exceptional 22.9% |
Demographics Similar to Celtics by 3 or more Vehicles in Household
In terms of 3 or more vehicles in household, the demographic groups most similar to Celtics are Afghan (21.7%, a difference of 0.070%), Czechoslovakian (21.7%, a difference of 0.28%), Assyrian/Chaldean/Syriac (21.7%, a difference of 0.28%), Irish (21.8%, a difference of 0.41%), and Nonimmigrants (21.8%, a difference of 0.48%).
| Demographics | Rating | Rank | 3 or more Vehicles in Household |
| Immigrants | Oceania | 99.8 /100 | #74 | Exceptional 21.8% |
| Japanese | 99.8 /100 | #75 | Exceptional 21.8% |
| Immigrants | Nonimmigrants | 99.8 /100 | #76 | Exceptional 21.8% |
| Irish | 99.8 /100 | #77 | Exceptional 21.8% |
| Czechoslovakians | 99.8 /100 | #78 | Exceptional 21.7% |
| Assyrians/Chaldeans/Syriacs | 99.8 /100 | #79 | Exceptional 21.7% |
| Afghans | 99.7 /100 | #80 | Exceptional 21.7% |
| Celtics | 99.7 /100 | #81 | Exceptional 21.7% |
| Immigrants | El Salvador | 99.6 /100 | #82 | Exceptional 21.5% |
| Chippewa | 99.6 /100 | #83 | Exceptional 21.5% |
| Icelanders | 99.6 /100 | #84 | Exceptional 21.5% |
| Laotians | 99.6 /100 | #85 | Exceptional 21.5% |
| Delaware | 99.6 /100 | #86 | Exceptional 21.5% |
| Immigrants | Azores | 99.5 /100 | #87 | Exceptional 21.5% |
| French | 99.4 /100 | #88 | Exceptional 21.4% |