Haitian vs Immigrants from Jordan Currently Married
COMPARE
Haitian
Immigrants from Jordan
Currently Married
Currently Married Comparison
Haitians
Immigrants from Jordan
41.3%
CURRENTLY MARRIED
0.0/ 100
METRIC RATING
317th/ 347
METRIC RANK
47.4%
CURRENTLY MARRIED
84.9/ 100
METRIC RATING
126th/ 347
METRIC RANK
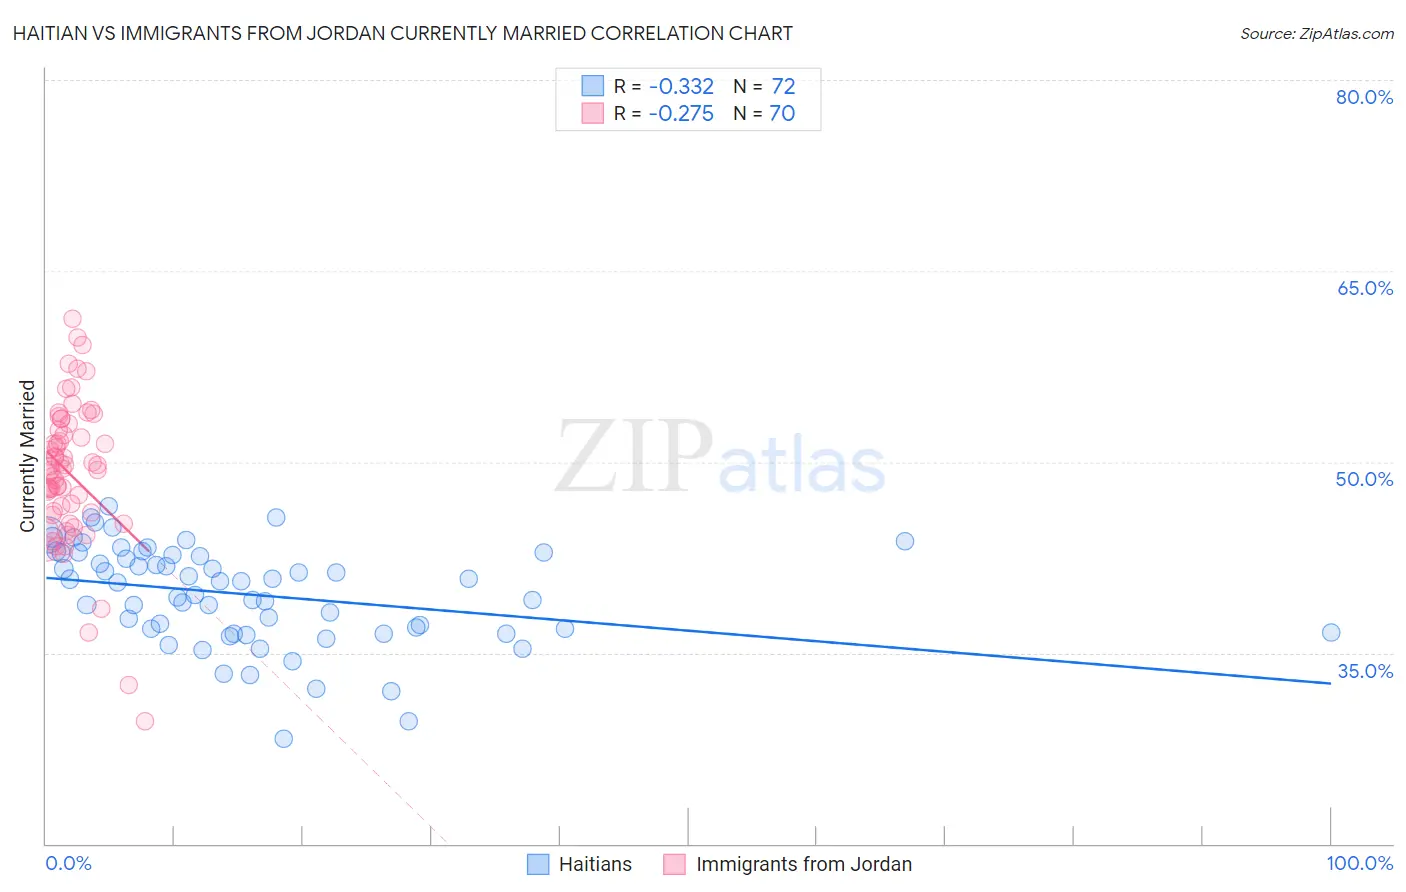
Haitian vs Immigrants from Jordan Currently Married Correlation Chart
The statistical analysis conducted on geographies consisting of 287,965,636 people shows a mild negative correlation between the proportion of Haitians and percentage of population currently married in the United States with a correlation coefficient (R) of -0.332 and weighted average of 41.3%. Similarly, the statistical analysis conducted on geographies consisting of 181,237,852 people shows a weak negative correlation between the proportion of Immigrants from Jordan and percentage of population currently married in the United States with a correlation coefficient (R) of -0.275 and weighted average of 47.4%, a difference of 14.8%.
Currently Married Correlation Summary
| Measurement | Haitian | Immigrants from Jordan |
| Minimum | 28.3% | 29.6% |
| Maximum | 46.5% | 61.2% |
| Range | 18.2% | 31.6% |
| Mean | 39.6% | 49.1% |
| Median | 40.6% | 49.4% |
| Interquartile 25% (IQ1) | 36.7% | 46.0% |
| Interquartile 75% (IQ3) | 42.8% | 52.5% |
| Interquartile Range (IQR) | 6.1% | 6.5% |
| Standard Deviation (Sample) | 3.9% | 5.7% |
| Standard Deviation (Population) | 3.9% | 5.6% |
Similar Demographics by Currently Married
Demographics Similar to Haitians by Currently Married
In terms of currently married, the demographic groups most similar to Haitians are Immigrants from Caribbean (41.3%, a difference of 0.020%), Inupiat (41.3%, a difference of 0.080%), West Indian (41.3%, a difference of 0.17%), Bahamian (41.2%, a difference of 0.18%), and Immigrants from Somalia (41.2%, a difference of 0.20%).
| Demographics | Rating | Rank | Currently Married |
| Guyanese | 0.0 /100 | #310 | Tragic 41.6% |
| Trinidadians and Tobagonians | 0.0 /100 | #311 | Tragic 41.5% |
| Somalis | 0.0 /100 | #312 | Tragic 41.5% |
| Jamaicans | 0.0 /100 | #313 | Tragic 41.4% |
| West Indians | 0.0 /100 | #314 | Tragic 41.3% |
| Inupiat | 0.0 /100 | #315 | Tragic 41.3% |
| Immigrants | Caribbean | 0.0 /100 | #316 | Tragic 41.3% |
| Haitians | 0.0 /100 | #317 | Tragic 41.3% |
| Bahamians | 0.0 /100 | #318 | Tragic 41.2% |
| Immigrants | Somalia | 0.0 /100 | #319 | Tragic 41.2% |
| Immigrants | Jamaica | 0.0 /100 | #320 | Tragic 41.1% |
| Immigrants | Congo | 0.0 /100 | #321 | Tragic 41.1% |
| Immigrants | Haiti | 0.0 /100 | #322 | Tragic 41.0% |
| Immigrants | West Indies | 0.0 /100 | #323 | Tragic 40.7% |
| Immigrants | Senegal | 0.0 /100 | #324 | Tragic 40.7% |
Demographics Similar to Immigrants from Jordan by Currently Married
In terms of currently married, the demographic groups most similar to Immigrants from Jordan are New Zealander (47.4%, a difference of 0.0%), Okinawan (47.4%, a difference of 0.030%), Portuguese (47.3%, a difference of 0.050%), Sri Lankan (47.3%, a difference of 0.11%), and Laotian (47.4%, a difference of 0.13%).
| Demographics | Rating | Rank | Currently Married |
| Australians | 90.2 /100 | #119 | Exceptional 47.6% |
| Syrians | 88.9 /100 | #120 | Excellent 47.5% |
| Immigrants | Croatia | 88.6 /100 | #121 | Excellent 47.5% |
| Osage | 87.9 /100 | #122 | Excellent 47.5% |
| Immigrants | Kazakhstan | 87.2 /100 | #123 | Excellent 47.4% |
| Laotians | 86.6 /100 | #124 | Excellent 47.4% |
| Okinawans | 85.3 /100 | #125 | Excellent 47.4% |
| Immigrants | Jordan | 84.9 /100 | #126 | Excellent 47.4% |
| New Zealanders | 84.9 /100 | #127 | Excellent 47.4% |
| Portuguese | 84.2 /100 | #128 | Excellent 47.3% |
| Sri Lankans | 83.2 /100 | #129 | Excellent 47.3% |
| Immigrants | Iraq | 82.8 /100 | #130 | Excellent 47.3% |
| Icelanders | 82.4 /100 | #131 | Excellent 47.3% |
| Afghans | 81.8 /100 | #132 | Excellent 47.3% |
| Immigrants | Malaysia | 81.1 /100 | #133 | Excellent 47.3% |