Haitian vs Immigrants from Jordan Median Female Earnings
COMPARE
Haitian
Immigrants from Jordan
Median Female Earnings
Median Female Earnings Comparison
Haitians
Immigrants from Jordan
$36,374
MEDIAN FEMALE EARNINGS
0.1/ 100
METRIC RATING
282nd/ 347
METRIC RANK
$40,977
MEDIAN FEMALE EARNINGS
93.5/ 100
METRIC RATING
122nd/ 347
METRIC RANK
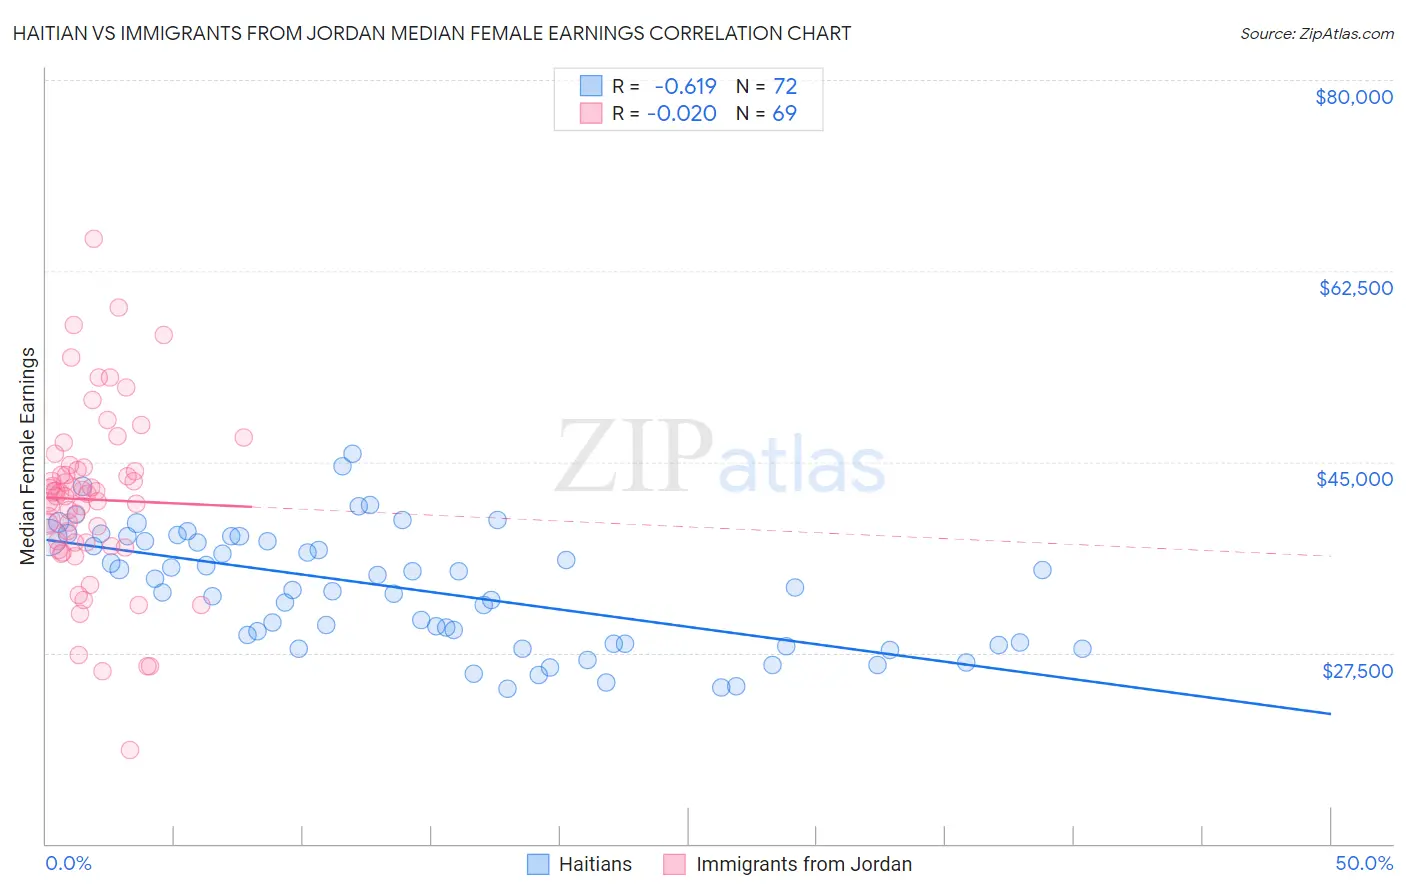
Haitian vs Immigrants from Jordan Median Female Earnings Correlation Chart
The statistical analysis conducted on geographies consisting of 287,899,387 people shows a significant negative correlation between the proportion of Haitians and median female earnings in the United States with a correlation coefficient (R) of -0.619 and weighted average of $36,374. Similarly, the statistical analysis conducted on geographies consisting of 181,274,544 people shows no correlation between the proportion of Immigrants from Jordan and median female earnings in the United States with a correlation coefficient (R) of -0.020 and weighted average of $40,977, a difference of 12.7%.
Median Female Earnings Correlation Summary
| Measurement | Haitian | Immigrants from Jordan |
| Minimum | $24,245 | $18,558 |
| Maximum | $45,799 | $65,466 |
| Range | $21,554 | $46,908 |
| Mean | $33,333 | $41,547 |
| Median | $33,334 | $42,113 |
| Interquartile 25% (IQ1) | $28,287 | $37,412 |
| Interquartile 75% (IQ3) | $37,934 | $44,413 |
| Interquartile Range (IQR) | $9,647 | $7,001 |
| Standard Deviation (Sample) | $5,376 | $8,068 |
| Standard Deviation (Population) | $5,339 | $8,010 |
Similar Demographics by Median Female Earnings
Demographics Similar to Haitians by Median Female Earnings
In terms of median female earnings, the demographic groups most similar to Haitians are Spanish American ($36,391, a difference of 0.050%), Iroquois ($36,408, a difference of 0.090%), Immigrants from Caribbean ($36,414, a difference of 0.11%), U.S. Virgin Islander ($36,424, a difference of 0.14%), and Marshallese ($36,459, a difference of 0.24%).
| Demographics | Rating | Rank | Median Female Earnings |
| Africans | 0.1 /100 | #275 | Tragic $36,530 |
| Central Americans | 0.1 /100 | #276 | Tragic $36,492 |
| Marshallese | 0.1 /100 | #277 | Tragic $36,459 |
| U.S. Virgin Islanders | 0.1 /100 | #278 | Tragic $36,424 |
| Immigrants | Caribbean | 0.1 /100 | #279 | Tragic $36,414 |
| Iroquois | 0.1 /100 | #280 | Tragic $36,408 |
| Spanish Americans | 0.1 /100 | #281 | Tragic $36,391 |
| Haitians | 0.1 /100 | #282 | Tragic $36,374 |
| Immigrants | Haiti | 0.1 /100 | #283 | Tragic $36,203 |
| Indonesians | 0.1 /100 | #284 | Tragic $36,140 |
| Paiute | 0.1 /100 | #285 | Tragic $36,056 |
| Osage | 0.0 /100 | #286 | Tragic $36,034 |
| Immigrants | Nicaragua | 0.0 /100 | #287 | Tragic $36,023 |
| Immigrants | Zaire | 0.0 /100 | #288 | Tragic $36,017 |
| Bangladeshis | 0.0 /100 | #289 | Tragic $35,960 |
Demographics Similar to Immigrants from Jordan by Median Female Earnings
In terms of median female earnings, the demographic groups most similar to Immigrants from Jordan are Guyanese ($40,973, a difference of 0.010%), Croatian ($40,993, a difference of 0.040%), Trinidadian and Tobagonian ($40,958, a difference of 0.050%), Austrian ($40,923, a difference of 0.13%), and Immigrants from Kuwait ($41,055, a difference of 0.19%).
| Demographics | Rating | Rank | Median Female Earnings |
| Koreans | 96.4 /100 | #115 | Exceptional $41,276 |
| Immigrants | Brazil | 96.4 /100 | #116 | Exceptional $41,273 |
| Barbadians | 96.3 /100 | #117 | Exceptional $41,261 |
| Immigrants | Lebanon | 95.6 /100 | #118 | Exceptional $41,183 |
| Immigrants | Philippines | 95.0 /100 | #119 | Exceptional $41,114 |
| Immigrants | Kuwait | 94.4 /100 | #120 | Exceptional $41,055 |
| Croatians | 93.7 /100 | #121 | Exceptional $40,993 |
| Immigrants | Jordan | 93.5 /100 | #122 | Exceptional $40,977 |
| Guyanese | 93.4 /100 | #123 | Exceptional $40,973 |
| Trinidadians and Tobagonians | 93.2 /100 | #124 | Exceptional $40,958 |
| Austrians | 92.7 /100 | #125 | Exceptional $40,923 |
| Immigrants | Trinidad and Tobago | 92.3 /100 | #126 | Exceptional $40,895 |
| Ugandans | 92.2 /100 | #127 | Exceptional $40,889 |
| Carpatho Rusyns | 91.2 /100 | #128 | Exceptional $40,825 |
| Zimbabweans | 90.8 /100 | #129 | Exceptional $40,798 |