Guamanian/Chamorro vs Central American 3 or more Vehicles in Household
COMPARE
Guamanian/Chamorro
Central American
3 or more Vehicles in Household
3 or more Vehicles in Household Comparison
Guamanians/Chamorros
Central Americans
23.2%
3 OR MORE VEHICLES IN HOUSEHOLD
100.0/ 100
METRIC RATING
27th/ 347
METRIC RANK
20.5%
3 OR MORE VEHICLES IN HOUSEHOLD
93.1/ 100
METRIC RATING
124th/ 347
METRIC RANK
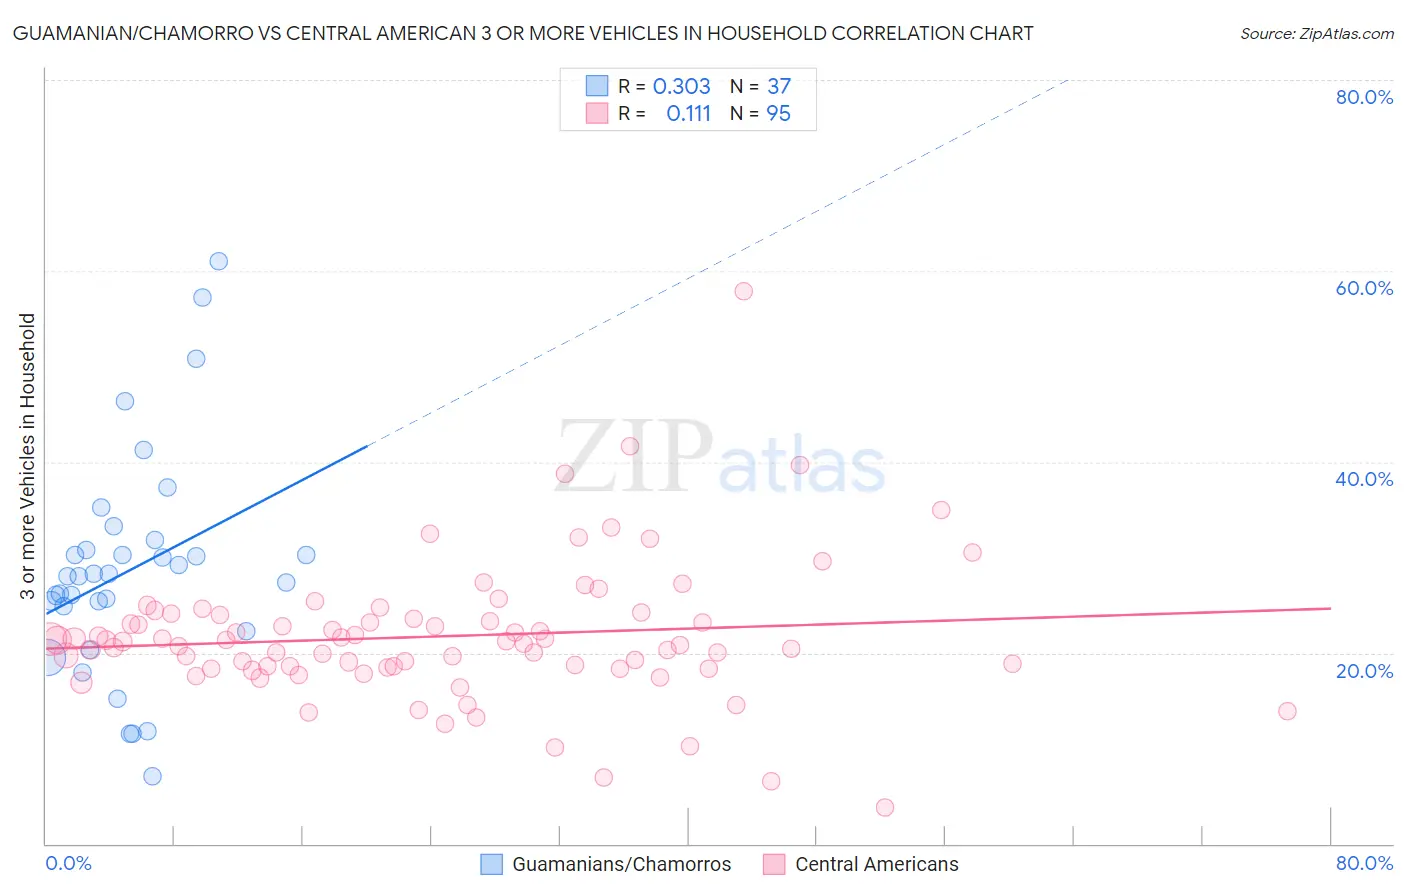
Guamanian/Chamorro vs Central American 3 or more Vehicles in Household Correlation Chart
The statistical analysis conducted on geographies consisting of 221,863,982 people shows a mild positive correlation between the proportion of Guamanians/Chamorros and percentage of households with 3 or more vehicles available in the United States with a correlation coefficient (R) of 0.303 and weighted average of 23.2%. Similarly, the statistical analysis conducted on geographies consisting of 503,902,726 people shows a poor positive correlation between the proportion of Central Americans and percentage of households with 3 or more vehicles available in the United States with a correlation coefficient (R) of 0.111 and weighted average of 20.5%, a difference of 13.5%.
3 or more Vehicles in Household Correlation Summary
| Measurement | Guamanian/Chamorro | Central American |
| Minimum | 7.1% | 3.8% |
| Maximum | 61.0% | 57.9% |
| Range | 53.9% | 54.0% |
| Mean | 28.7% | 21.7% |
| Median | 28.0% | 21.2% |
| Interquartile 25% (IQ1) | 23.6% | 18.5% |
| Interquartile 75% (IQ3) | 31.3% | 24.0% |
| Interquartile Range (IQR) | 7.8% | 5.5% |
| Standard Deviation (Sample) | 11.6% | 7.4% |
| Standard Deviation (Population) | 11.5% | 7.3% |
Similar Demographics by 3 or more Vehicles in Household
Demographics Similar to Guamanians/Chamorros by 3 or more Vehicles in Household
In terms of 3 or more vehicles in household, the demographic groups most similar to Guamanians/Chamorros are Mexican American Indian (23.3%, a difference of 0.13%), Lumbee (23.1%, a difference of 0.33%), Spanish (23.1%, a difference of 0.40%), Immigrants from South Eastern Asia (23.1%, a difference of 0.57%), and English (23.1%, a difference of 0.76%).
| Demographics | Rating | Rank | 3 or more Vehicles in Household |
| Paiute | 100.0 /100 | #20 | Exceptional 23.8% |
| Immigrants | Vietnam | 100.0 /100 | #21 | Exceptional 23.8% |
| Immigrants | Philippines | 100.0 /100 | #22 | Exceptional 23.8% |
| Scandinavians | 100.0 /100 | #23 | Exceptional 23.6% |
| Sri Lankans | 100.0 /100 | #24 | Exceptional 23.6% |
| Immigrants | Central America | 100.0 /100 | #25 | Exceptional 23.4% |
| Mexican American Indians | 100.0 /100 | #26 | Exceptional 23.3% |
| Guamanians/Chamorros | 100.0 /100 | #27 | Exceptional 23.2% |
| Lumbee | 100.0 /100 | #28 | Exceptional 23.1% |
| Spanish | 100.0 /100 | #29 | Exceptional 23.1% |
| Immigrants | South Eastern Asia | 100.0 /100 | #30 | Exceptional 23.1% |
| English | 100.0 /100 | #31 | Exceptional 23.1% |
| Pueblo | 100.0 /100 | #32 | Exceptional 23.0% |
| Spanish Americans | 100.0 /100 | #33 | Exceptional 23.0% |
| Swiss | 100.0 /100 | #34 | Exceptional 23.0% |
Demographics Similar to Central Americans by 3 or more Vehicles in Household
In terms of 3 or more vehicles in household, the demographic groups most similar to Central Americans are Immigrants from Netherlands (20.4%, a difference of 0.030%), Immigrants from Korea (20.5%, a difference of 0.17%), German Russian (20.5%, a difference of 0.18%), Immigrants from Thailand (20.5%, a difference of 0.22%), and Maltese (20.5%, a difference of 0.24%).
| Demographics | Rating | Rank | 3 or more Vehicles in Household |
| Croatians | 94.9 /100 | #117 | Exceptional 20.6% |
| Costa Ricans | 94.6 /100 | #118 | Exceptional 20.6% |
| Immigrants | Latin America | 94.5 /100 | #119 | Exceptional 20.5% |
| Maltese | 93.9 /100 | #120 | Exceptional 20.5% |
| Immigrants | Thailand | 93.8 /100 | #121 | Exceptional 20.5% |
| German Russians | 93.7 /100 | #122 | Exceptional 20.5% |
| Immigrants | Korea | 93.7 /100 | #123 | Exceptional 20.5% |
| Central Americans | 93.1 /100 | #124 | Exceptional 20.5% |
| Immigrants | Netherlands | 92.9 /100 | #125 | Exceptional 20.4% |
| Slavs | 92.1 /100 | #126 | Exceptional 20.4% |
| Immigrants | Bolivia | 92.0 /100 | #127 | Exceptional 20.4% |
| New Zealanders | 91.3 /100 | #128 | Exceptional 20.4% |
| Zimbabweans | 88.7 /100 | #129 | Excellent 20.3% |
| Greeks | 88.6 /100 | #130 | Excellent 20.3% |
| Immigrants | Asia | 88.1 /100 | #131 | Excellent 20.2% |