Menominee vs Central American No Vehicles in Household
COMPARE
Menominee
Central American
No Vehicles in Household
No Vehicles in Household Comparison
Menominee
Central Americans
11.8%
NO VEHICLES IN HOUSEHOLD
2.0/ 100
METRIC RATING
246th/ 347
METRIC RANK
10.8%
NO VEHICLES IN HOUSEHOLD
24.3/ 100
METRIC RATING
196th/ 347
METRIC RANK
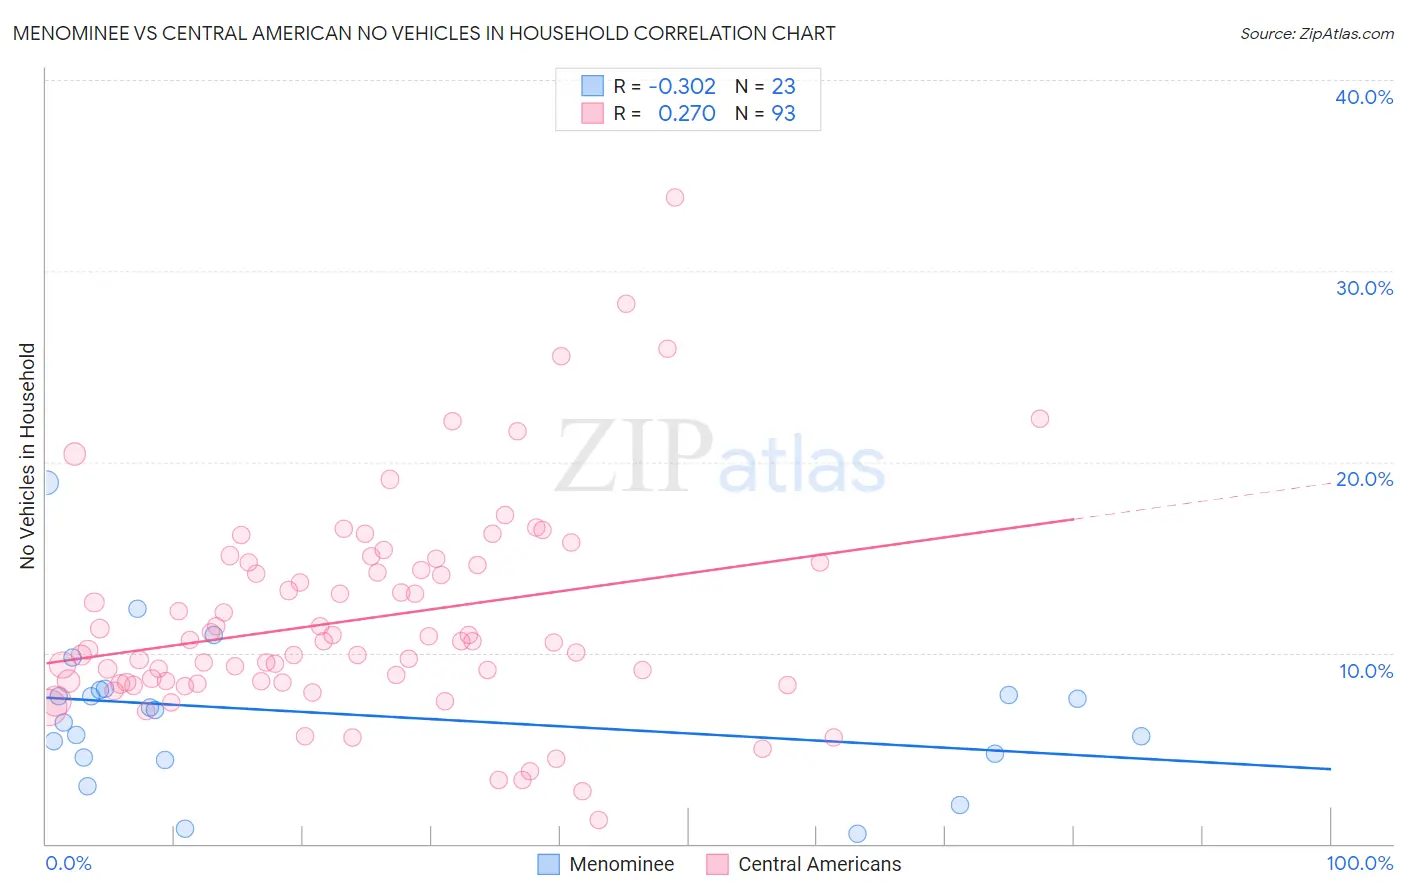
Menominee vs Central American No Vehicles in Household Correlation Chart
The statistical analysis conducted on geographies consisting of 45,769,644 people shows a mild negative correlation between the proportion of Menominee and percentage of households with no vehicle available in the United States with a correlation coefficient (R) of -0.302 and weighted average of 11.8%. Similarly, the statistical analysis conducted on geographies consisting of 502,389,156 people shows a weak positive correlation between the proportion of Central Americans and percentage of households with no vehicle available in the United States with a correlation coefficient (R) of 0.270 and weighted average of 10.8%, a difference of 9.0%.
No Vehicles in Household Correlation Summary
| Measurement | Menominee | Central American |
| Minimum | 0.55% | 1.3% |
| Maximum | 18.9% | 33.8% |
| Range | 18.3% | 32.6% |
| Mean | 6.8% | 11.8% |
| Median | 7.0% | 10.6% |
| Interquartile 25% (IQ1) | 4.5% | 8.4% |
| Interquartile 75% (IQ3) | 8.1% | 14.7% |
| Interquartile Range (IQR) | 3.5% | 6.2% |
| Standard Deviation (Sample) | 3.9% | 5.5% |
| Standard Deviation (Population) | 3.8% | 5.5% |
Similar Demographics by No Vehicles in Household
Demographics Similar to Menominee by No Vehicles in Household
In terms of no vehicles in household, the demographic groups most similar to Menominee are Immigrants from Czechoslovakia (11.8%, a difference of 0.050%), Immigrants from Belgium (11.8%, a difference of 0.060%), Immigrants from Nigeria (11.8%, a difference of 0.10%), Immigrants from Honduras (11.8%, a difference of 0.17%), and Paiute (11.8%, a difference of 0.32%).
| Demographics | Rating | Rank | No Vehicles in Household |
| Taiwanese | 2.8 /100 | #239 | Tragic 11.7% |
| Immigrants | Immigrants | 2.7 /100 | #240 | Tragic 11.7% |
| Eastern Europeans | 2.7 /100 | #241 | Tragic 11.7% |
| Turks | 2.6 /100 | #242 | Tragic 11.7% |
| Cheyenne | 2.4 /100 | #243 | Tragic 11.7% |
| Immigrants | Portugal | 2.2 /100 | #244 | Tragic 11.7% |
| Immigrants | Honduras | 2.1 /100 | #245 | Tragic 11.8% |
| Menominee | 2.0 /100 | #246 | Tragic 11.8% |
| Immigrants | Czechoslovakia | 2.0 /100 | #247 | Tragic 11.8% |
| Immigrants | Belgium | 1.9 /100 | #248 | Tragic 11.8% |
| Immigrants | Nigeria | 1.9 /100 | #249 | Tragic 11.8% |
| Paiute | 1.8 /100 | #250 | Tragic 11.8% |
| Blacks/African Americans | 1.6 /100 | #251 | Tragic 11.9% |
| Immigrants | Serbia | 1.5 /100 | #252 | Tragic 11.9% |
| Egyptians | 1.4 /100 | #253 | Tragic 11.9% |
Demographics Similar to Central Americans by No Vehicles in Household
In terms of no vehicles in household, the demographic groups most similar to Central Americans are Shoshone (10.8%, a difference of 0.040%), Immigrants from Sweden (10.8%, a difference of 0.25%), Immigrants from Brazil (10.8%, a difference of 0.34%), Pueblo (10.8%, a difference of 0.45%), and Immigrants from Asia (10.9%, a difference of 0.56%).
| Demographics | Rating | Rank | No Vehicles in Household |
| Immigrants | Eritrea | 36.3 /100 | #189 | Fair 10.6% |
| Immigrants | North Macedonia | 34.6 /100 | #190 | Fair 10.6% |
| Immigrants | Northern Europe | 33.1 /100 | #191 | Fair 10.7% |
| Carpatho Rusyns | 32.1 /100 | #192 | Fair 10.7% |
| Ukrainians | 28.0 /100 | #193 | Fair 10.7% |
| Pueblo | 27.0 /100 | #194 | Fair 10.8% |
| Immigrants | Brazil | 26.3 /100 | #195 | Fair 10.8% |
| Central Americans | 24.3 /100 | #196 | Fair 10.8% |
| Shoshone | 24.1 /100 | #197 | Fair 10.8% |
| Immigrants | Sweden | 22.9 /100 | #198 | Fair 10.8% |
| Immigrants | Asia | 21.3 /100 | #199 | Fair 10.9% |
| Cambodians | 19.6 /100 | #200 | Poor 10.9% |
| Immigrants | Western Europe | 19.1 /100 | #201 | Poor 10.9% |
| Romanians | 17.9 /100 | #202 | Poor 10.9% |
| Iroquois | 17.6 /100 | #203 | Poor 10.9% |