Brazilian vs Central American No Vehicles in Household
COMPARE
Brazilian
Central American
No Vehicles in Household
No Vehicles in Household Comparison
Brazilians
Central Americans
10.4%
NO VEHICLES IN HOUSEHOLD
51.7/ 100
METRIC RATING
172nd/ 347
METRIC RANK
10.8%
NO VEHICLES IN HOUSEHOLD
24.3/ 100
METRIC RATING
196th/ 347
METRIC RANK
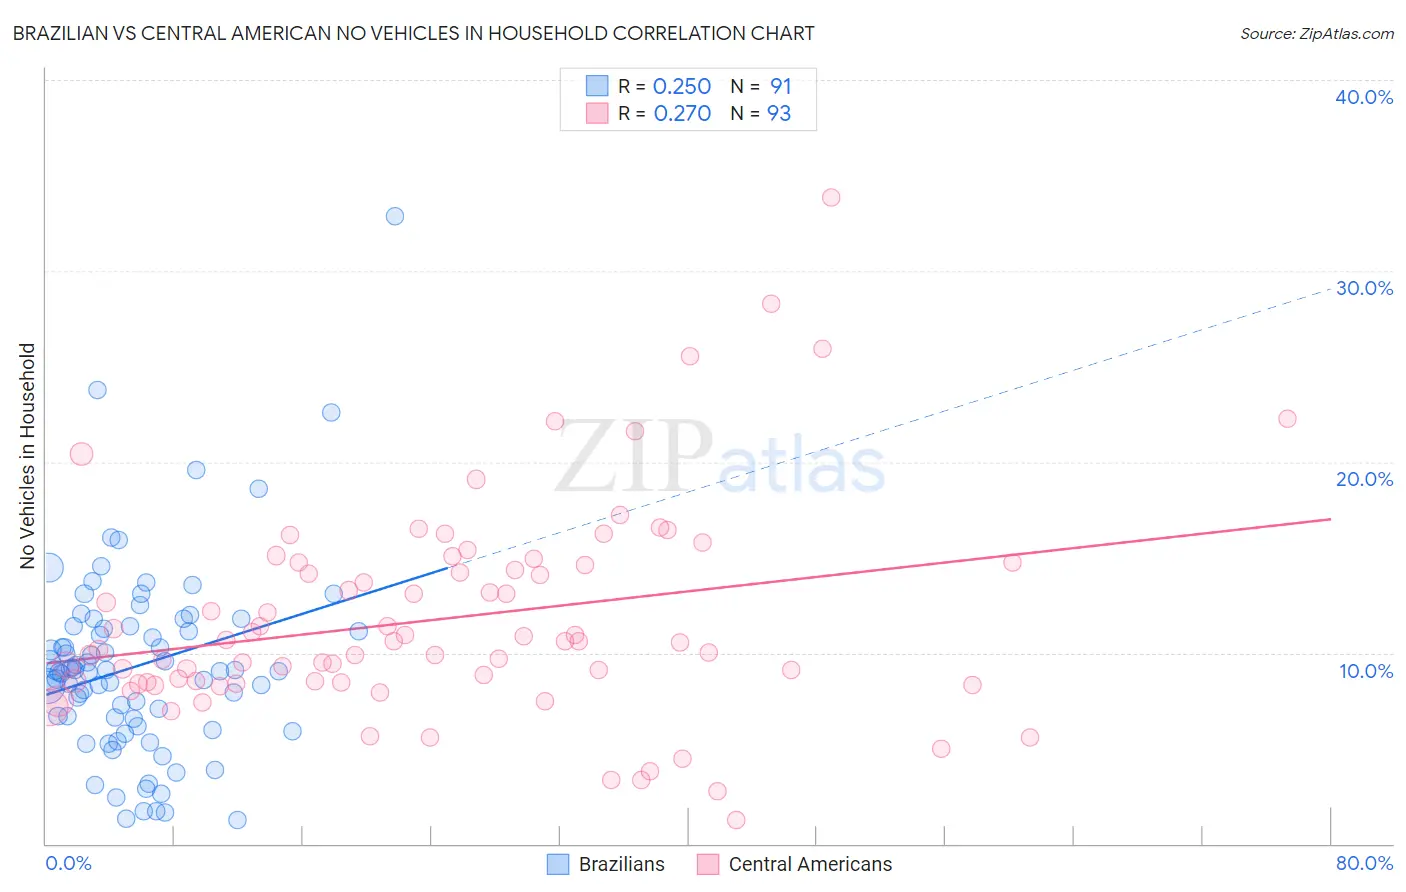
Brazilian vs Central American No Vehicles in Household Correlation Chart
The statistical analysis conducted on geographies consisting of 322,964,874 people shows a weak positive correlation between the proportion of Brazilians and percentage of households with no vehicle available in the United States with a correlation coefficient (R) of 0.250 and weighted average of 10.4%. Similarly, the statistical analysis conducted on geographies consisting of 502,389,156 people shows a weak positive correlation between the proportion of Central Americans and percentage of households with no vehicle available in the United States with a correlation coefficient (R) of 0.270 and weighted average of 10.8%, a difference of 4.1%.
No Vehicles in Household Correlation Summary
| Measurement | Brazilian | Central American |
| Minimum | 1.2% | 1.3% |
| Maximum | 32.9% | 33.8% |
| Range | 31.6% | 32.6% |
| Mean | 9.3% | 11.8% |
| Median | 9.0% | 10.6% |
| Interquartile 25% (IQ1) | 6.6% | 8.4% |
| Interquartile 75% (IQ3) | 11.4% | 14.7% |
| Interquartile Range (IQR) | 4.8% | 6.2% |
| Standard Deviation (Sample) | 5.0% | 5.5% |
| Standard Deviation (Population) | 5.0% | 5.5% |
Similar Demographics by No Vehicles in Household
Demographics Similar to Brazilians by No Vehicles in Household
In terms of no vehicles in household, the demographic groups most similar to Brazilians are Hmong (10.4%, a difference of 0.14%), Immigrants from Latin America (10.4%, a difference of 0.21%), Filipino (10.4%, a difference of 0.22%), Immigrants from Sudan (10.4%, a difference of 0.23%), and Immigrants from Burma/Myanmar (10.4%, a difference of 0.34%).
| Demographics | Rating | Rank | No Vehicles in Household |
| Comanche | 60.8 /100 | #165 | Good 10.2% |
| Immigrants | Costa Rica | 60.5 /100 | #166 | Good 10.3% |
| Immigrants | Saudi Arabia | 58.8 /100 | #167 | Average 10.3% |
| Indonesians | 56.7 /100 | #168 | Average 10.3% |
| Lumbee | 54.7 /100 | #169 | Average 10.3% |
| Immigrants | Latin America | 53.2 /100 | #170 | Average 10.4% |
| Hmong | 52.7 /100 | #171 | Average 10.4% |
| Brazilians | 51.7 /100 | #172 | Average 10.4% |
| Filipinos | 50.1 /100 | #173 | Average 10.4% |
| Immigrants | Sudan | 50.0 /100 | #174 | Average 10.4% |
| Immigrants | Burma/Myanmar | 49.1 /100 | #175 | Average 10.4% |
| French American Indians | 49.1 /100 | #176 | Average 10.4% |
| Immigrants | El Salvador | 49.1 /100 | #177 | Average 10.4% |
| Immigrants | Ethiopia | 48.0 /100 | #178 | Average 10.4% |
| Ethiopians | 45.8 /100 | #179 | Average 10.5% |
Demographics Similar to Central Americans by No Vehicles in Household
In terms of no vehicles in household, the demographic groups most similar to Central Americans are Shoshone (10.8%, a difference of 0.040%), Immigrants from Sweden (10.8%, a difference of 0.25%), Immigrants from Brazil (10.8%, a difference of 0.34%), Pueblo (10.8%, a difference of 0.45%), and Immigrants from Asia (10.9%, a difference of 0.56%).
| Demographics | Rating | Rank | No Vehicles in Household |
| Immigrants | Eritrea | 36.3 /100 | #189 | Fair 10.6% |
| Immigrants | North Macedonia | 34.6 /100 | #190 | Fair 10.6% |
| Immigrants | Northern Europe | 33.1 /100 | #191 | Fair 10.7% |
| Carpatho Rusyns | 32.1 /100 | #192 | Fair 10.7% |
| Ukrainians | 28.0 /100 | #193 | Fair 10.7% |
| Pueblo | 27.0 /100 | #194 | Fair 10.8% |
| Immigrants | Brazil | 26.3 /100 | #195 | Fair 10.8% |
| Central Americans | 24.3 /100 | #196 | Fair 10.8% |
| Shoshone | 24.1 /100 | #197 | Fair 10.8% |
| Immigrants | Sweden | 22.9 /100 | #198 | Fair 10.8% |
| Immigrants | Asia | 21.3 /100 | #199 | Fair 10.9% |
| Cambodians | 19.6 /100 | #200 | Poor 10.9% |
| Immigrants | Western Europe | 19.1 /100 | #201 | Poor 10.9% |
| Romanians | 17.9 /100 | #202 | Poor 10.9% |
| Iroquois | 17.6 /100 | #203 | Poor 10.9% |