Ghanaian vs Korean 3 or more Vehicles in Household
COMPARE
Ghanaian
Korean
3 or more Vehicles in Household
3 or more Vehicles in Household Comparison
Ghanaians
Koreans
16.4%
3 OR MORE VEHICLES IN HOUSEHOLD
0.0/ 100
METRIC RATING
304th/ 347
METRIC RANK
24.1%
3 OR MORE VEHICLES IN HOUSEHOLD
100.0/ 100
METRIC RATING
17th/ 347
METRIC RANK
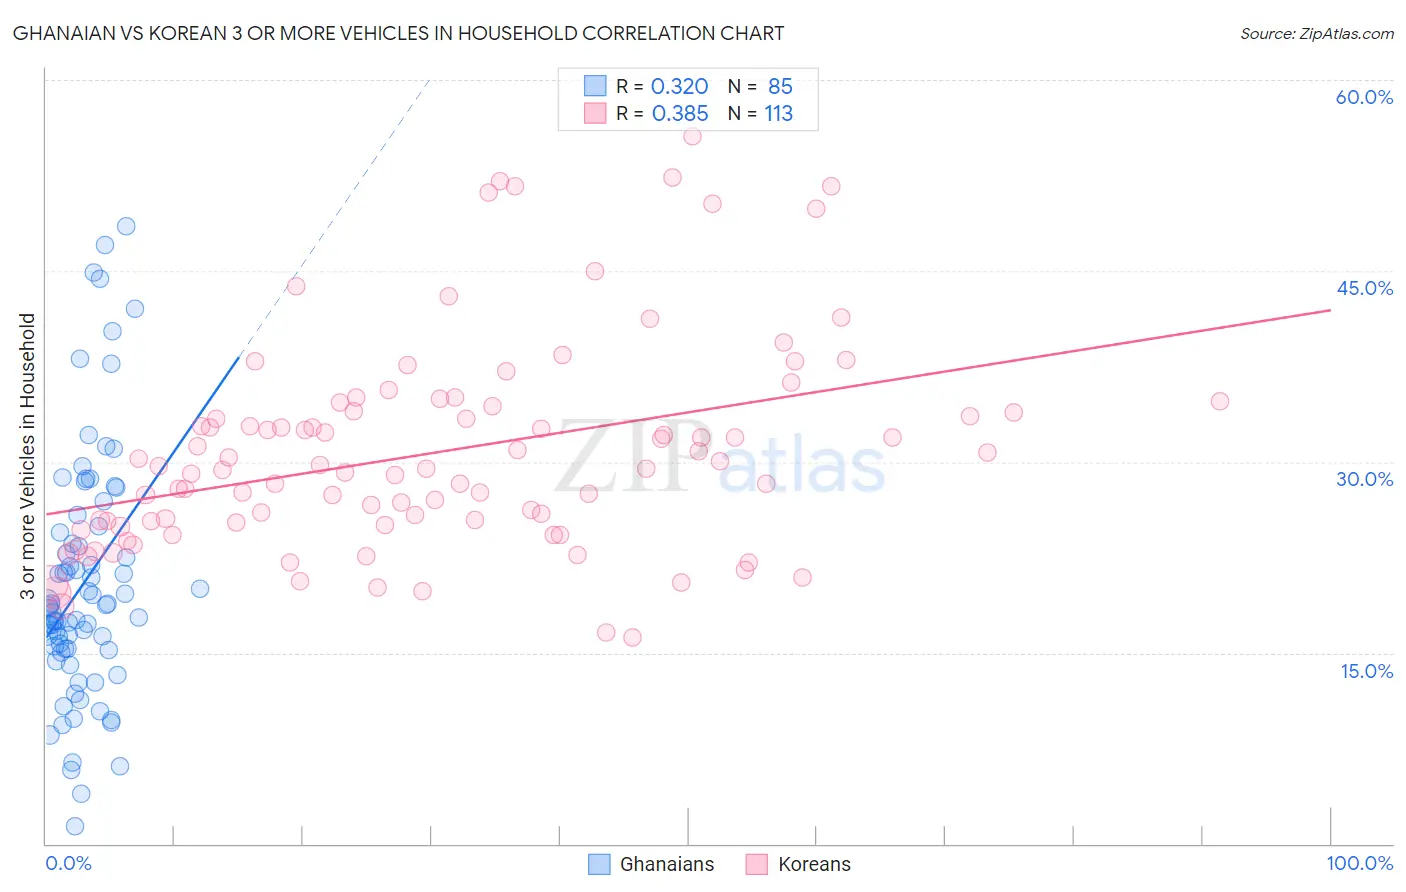
Ghanaian vs Korean 3 or more Vehicles in Household Correlation Chart
The statistical analysis conducted on geographies consisting of 190,488,118 people shows a mild positive correlation between the proportion of Ghanaians and percentage of households with 3 or more vehicles available in the United States with a correlation coefficient (R) of 0.320 and weighted average of 16.4%. Similarly, the statistical analysis conducted on geographies consisting of 510,183,740 people shows a mild positive correlation between the proportion of Koreans and percentage of households with 3 or more vehicles available in the United States with a correlation coefficient (R) of 0.385 and weighted average of 24.1%, a difference of 47.1%.
3 or more Vehicles in Household Correlation Summary
| Measurement | Ghanaian | Korean |
| Minimum | 1.4% | 16.2% |
| Maximum | 48.5% | 55.6% |
| Range | 47.1% | 39.4% |
| Mean | 20.5% | 30.8% |
| Median | 18.7% | 29.4% |
| Interquartile 25% (IQ1) | 15.3% | 25.1% |
| Interquartile 75% (IQ3) | 24.7% | 34.2% |
| Interquartile Range (IQR) | 9.4% | 9.1% |
| Standard Deviation (Sample) | 9.7% | 8.3% |
| Standard Deviation (Population) | 9.7% | 8.2% |
Similar Demographics by 3 or more Vehicles in Household
Demographics Similar to Ghanaians by 3 or more Vehicles in Household
In terms of 3 or more vehicles in household, the demographic groups most similar to Ghanaians are Immigrants from Morocco (16.3%, a difference of 0.26%), Immigrants from Serbia (16.4%, a difference of 0.47%), Immigrants from Greece (16.5%, a difference of 0.78%), Somali (16.2%, a difference of 1.1%), and Paraguayan (16.6%, a difference of 1.2%).
| Demographics | Rating | Rank | 3 or more Vehicles in Household |
| Israelis | 0.1 /100 | #297 | Tragic 16.8% |
| Immigrants | Zaire | 0.1 /100 | #298 | Tragic 16.7% |
| Immigrants | South America | 0.1 /100 | #299 | Tragic 16.7% |
| Cypriots | 0.0 /100 | #300 | Tragic 16.6% |
| Paraguayans | 0.0 /100 | #301 | Tragic 16.6% |
| Immigrants | Greece | 0.0 /100 | #302 | Tragic 16.5% |
| Immigrants | Serbia | 0.0 /100 | #303 | Tragic 16.4% |
| Ghanaians | 0.0 /100 | #304 | Tragic 16.4% |
| Immigrants | Morocco | 0.0 /100 | #305 | Tragic 16.3% |
| Somalis | 0.0 /100 | #306 | Tragic 16.2% |
| Immigrants | Ghana | 0.0 /100 | #307 | Tragic 16.2% |
| Houma | 0.0 /100 | #308 | Tragic 16.1% |
| Immigrants | Somalia | 0.0 /100 | #309 | Tragic 15.9% |
| Moroccans | 0.0 /100 | #310 | Tragic 15.9% |
| Albanians | 0.0 /100 | #311 | Tragic 15.8% |
Demographics Similar to Koreans by 3 or more Vehicles in Household
In terms of 3 or more vehicles in household, the demographic groups most similar to Koreans are Norwegian (23.9%, a difference of 0.79%), Basque (24.3%, a difference of 0.80%), Chinese (23.9%, a difference of 0.82%), Hawaiian (24.3%, a difference of 0.83%), and Paiute (23.8%, a difference of 1.1%).
| Demographics | Rating | Rank | 3 or more Vehicles in Household |
| Nepalese | 100.0 /100 | #10 | Exceptional 24.9% |
| Shoshone | 100.0 /100 | #11 | Exceptional 24.9% |
| Danes | 100.0 /100 | #12 | Exceptional 24.7% |
| Mexicans | 100.0 /100 | #13 | Exceptional 24.7% |
| Immigrants | Mexico | 100.0 /100 | #14 | Exceptional 24.6% |
| Hawaiians | 100.0 /100 | #15 | Exceptional 24.3% |
| Basques | 100.0 /100 | #16 | Exceptional 24.3% |
| Koreans | 100.0 /100 | #17 | Exceptional 24.1% |
| Norwegians | 100.0 /100 | #18 | Exceptional 23.9% |
| Chinese | 100.0 /100 | #19 | Exceptional 23.9% |
| Paiute | 100.0 /100 | #20 | Exceptional 23.8% |
| Immigrants | Vietnam | 100.0 /100 | #21 | Exceptional 23.8% |
| Immigrants | Philippines | 100.0 /100 | #22 | Exceptional 23.8% |
| Scandinavians | 100.0 /100 | #23 | Exceptional 23.6% |
| Sri Lankans | 100.0 /100 | #24 | Exceptional 23.6% |