Ghanaian vs Estonian Child Poverty Among Boys Under 16
COMPARE
Ghanaian
Estonian
Child Poverty Among Boys Under 16
Child Poverty Among Boys Under 16 Comparison
Ghanaians
Estonians
18.9%
CHILD POVERTY AMONG BOYS UNDER 16
0.5/ 100
METRIC RATING
242nd/ 347
METRIC RANK
14.1%
CHILD POVERTY AMONG BOYS UNDER 16
99.4/ 100
METRIC RATING
44th/ 347
METRIC RANK
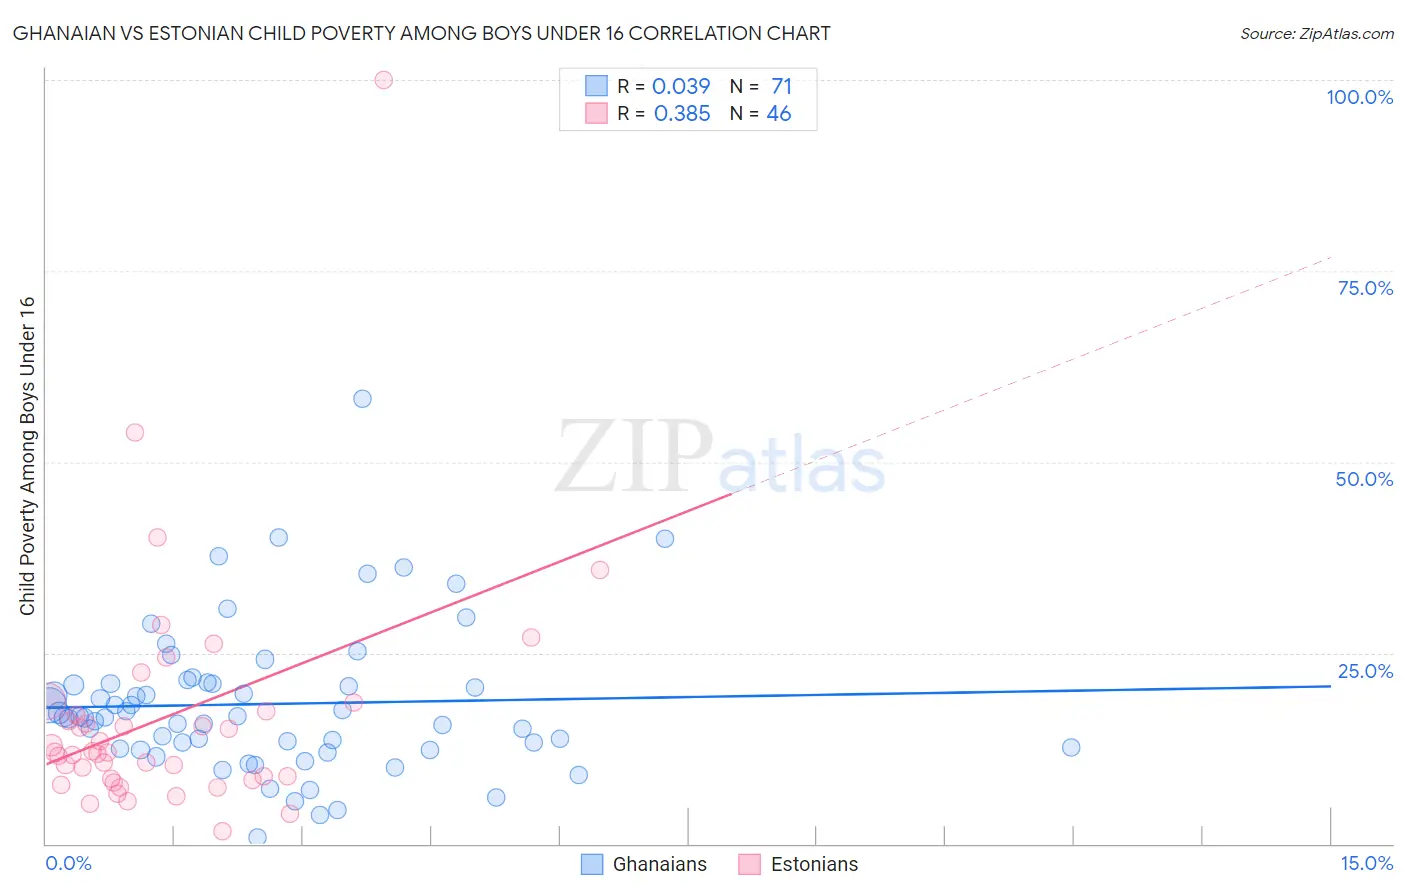
Ghanaian vs Estonian Child Poverty Among Boys Under 16 Correlation Chart
The statistical analysis conducted on geographies consisting of 189,368,520 people shows no correlation between the proportion of Ghanaians and poverty level among boys under the age of 16 in the United States with a correlation coefficient (R) of 0.039 and weighted average of 18.9%. Similarly, the statistical analysis conducted on geographies consisting of 122,063,894 people shows a mild positive correlation between the proportion of Estonians and poverty level among boys under the age of 16 in the United States with a correlation coefficient (R) of 0.385 and weighted average of 14.1%, a difference of 34.3%.
Child Poverty Among Boys Under 16 Correlation Summary
| Measurement | Ghanaian | Estonian |
| Minimum | 0.79% | 1.7% |
| Maximum | 58.3% | 100.0% |
| Range | 57.5% | 98.3% |
| Mean | 18.3% | 16.6% |
| Median | 16.6% | 12.0% |
| Interquartile 25% (IQ1) | 12.4% | 8.4% |
| Interquartile 75% (IQ3) | 21.0% | 17.4% |
| Interquartile Range (IQR) | 8.6% | 9.0% |
| Standard Deviation (Sample) | 9.7% | 16.0% |
| Standard Deviation (Population) | 9.6% | 15.8% |
Similar Demographics by Child Poverty Among Boys Under 16
Demographics Similar to Ghanaians by Child Poverty Among Boys Under 16
In terms of child poverty among boys under 16, the demographic groups most similar to Ghanaians are Immigrants from the Azores (18.9%, a difference of 0.34%), Immigrants from Middle Africa (18.9%, a difference of 0.35%), Cree (19.0%, a difference of 0.48%), Immigrants from Sudan (18.8%, a difference of 0.50%), and Immigrants from Cuba (18.8%, a difference of 0.56%).
| Demographics | Rating | Rank | Child Poverty Among Boys Under 16 |
| Americans | 0.9 /100 | #235 | Tragic 18.6% |
| Sudanese | 0.9 /100 | #236 | Tragic 18.6% |
| Immigrants | Eritrea | 0.8 /100 | #237 | Tragic 18.6% |
| Immigrants | Laos | 0.8 /100 | #238 | Tragic 18.7% |
| Cape Verdeans | 0.7 /100 | #239 | Tragic 18.7% |
| Immigrants | Cuba | 0.6 /100 | #240 | Tragic 18.8% |
| Immigrants | Sudan | 0.6 /100 | #241 | Tragic 18.8% |
| Ghanaians | 0.5 /100 | #242 | Tragic 18.9% |
| Immigrants | Azores | 0.4 /100 | #243 | Tragic 18.9% |
| Immigrants | Middle Africa | 0.4 /100 | #244 | Tragic 18.9% |
| Cree | 0.4 /100 | #245 | Tragic 19.0% |
| Immigrants | Nicaragua | 0.4 /100 | #246 | Tragic 19.0% |
| Immigrants | Trinidad and Tobago | 0.3 /100 | #247 | Tragic 19.0% |
| Salvadorans | 0.3 /100 | #248 | Tragic 19.0% |
| Alsatians | 0.3 /100 | #249 | Tragic 19.1% |
Demographics Similar to Estonians by Child Poverty Among Boys Under 16
In terms of child poverty among boys under 16, the demographic groups most similar to Estonians are Immigrants from Scotland (14.1%, a difference of 0.090%), Greek (14.1%, a difference of 0.20%), Croatian (14.0%, a difference of 0.21%), Immigrants from Moldova (14.1%, a difference of 0.47%), and Immigrants from Indonesia (14.1%, a difference of 0.49%).
| Demographics | Rating | Rank | Child Poverty Among Boys Under 16 |
| Immigrants | Sri Lanka | 99.6 /100 | #37 | Exceptional 13.9% |
| Immigrants | Northern Europe | 99.6 /100 | #38 | Exceptional 13.9% |
| Immigrants | Australia | 99.6 /100 | #39 | Exceptional 13.9% |
| Immigrants | Asia | 99.6 /100 | #40 | Exceptional 13.9% |
| Lithuanians | 99.6 /100 | #41 | Exceptional 14.0% |
| Koreans | 99.6 /100 | #42 | Exceptional 14.0% |
| Croatians | 99.5 /100 | #43 | Exceptional 14.0% |
| Estonians | 99.4 /100 | #44 | Exceptional 14.1% |
| Immigrants | Scotland | 99.4 /100 | #45 | Exceptional 14.1% |
| Greeks | 99.4 /100 | #46 | Exceptional 14.1% |
| Immigrants | Moldova | 99.4 /100 | #47 | Exceptional 14.1% |
| Immigrants | Indonesia | 99.4 /100 | #48 | Exceptional 14.1% |
| Czechs | 99.3 /100 | #49 | Exceptional 14.1% |
| Italians | 99.2 /100 | #50 | Exceptional 14.2% |
| Immigrants | Greece | 99.2 /100 | #51 | Exceptional 14.2% |