Ecuadorian vs Immigrants from Kenya Married-couple Households
COMPARE
Ecuadorian
Immigrants from Kenya
Married-couple Households
Married-couple Households Comparison
Ecuadorians
Immigrants from Kenya
43.5%
MARRIED-COUPLE HOUSEHOLDS
0.1/ 100
METRIC RATING
266th/ 347
METRIC RANK
44.1%
MARRIED-COUPLE HOUSEHOLDS
0.4/ 100
METRIC RATING
249th/ 347
METRIC RANK
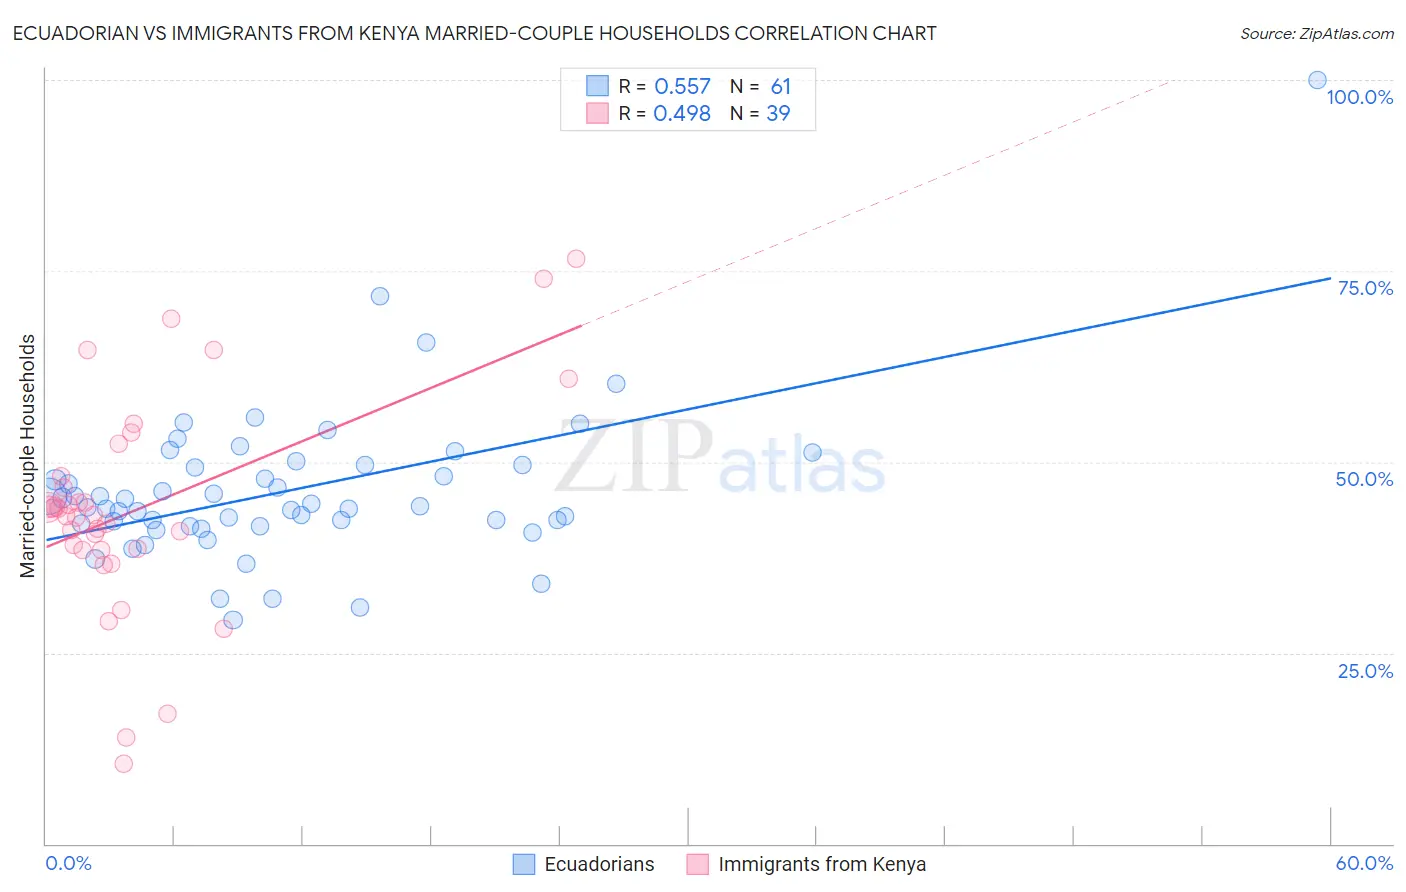
Ecuadorian vs Immigrants from Kenya Married-couple Households Correlation Chart
The statistical analysis conducted on geographies consisting of 317,636,169 people shows a substantial positive correlation between the proportion of Ecuadorians and percentage of married-couple family households in the United States with a correlation coefficient (R) of 0.557 and weighted average of 43.5%. Similarly, the statistical analysis conducted on geographies consisting of 217,996,178 people shows a moderate positive correlation between the proportion of Immigrants from Kenya and percentage of married-couple family households in the United States with a correlation coefficient (R) of 0.498 and weighted average of 44.1%, a difference of 1.3%.
Married-couple Households Correlation Summary
| Measurement | Ecuadorian | Immigrants from Kenya |
| Minimum | 29.3% | 10.5% |
| Maximum | 100.0% | 76.7% |
| Range | 70.7% | 66.2% |
| Mean | 46.3% | 43.9% |
| Median | 44.3% | 43.1% |
| Interquartile 25% (IQ1) | 41.8% | 38.5% |
| Interquartile 75% (IQ3) | 49.6% | 48.1% |
| Interquartile Range (IQR) | 7.8% | 9.6% |
| Standard Deviation (Sample) | 10.3% | 14.3% |
| Standard Deviation (Population) | 10.2% | 14.1% |
Demographics Similar to Ecuadorians and Immigrants from Kenya by Married-couple Households
In terms of married-couple households, the demographic groups most similar to Ecuadorians are Moroccan (43.5%, a difference of 0.040%), Native/Alaskan (43.5%, a difference of 0.050%), Bangladeshi (43.5%, a difference of 0.12%), Cree (43.6%, a difference of 0.23%), and Vietnamese (43.6%, a difference of 0.35%). Similarly, the demographic groups most similar to Immigrants from Kenya are French American Indian (44.1%, a difference of 0.010%), Yup'ik (44.1%, a difference of 0.050%), German Russian (44.0%, a difference of 0.090%), Seminole (44.0%, a difference of 0.16%), and Central American (43.9%, a difference of 0.28%).
| Demographics | Rating | Rank | Married-couple Households |
| Immigrants | Morocco | 0.6 /100 | #247 | Tragic 44.2% |
| Yup'ik | 0.4 /100 | #248 | Tragic 44.1% |
| Immigrants | Kenya | 0.4 /100 | #249 | Tragic 44.1% |
| French American Indians | 0.4 /100 | #250 | Tragic 44.1% |
| German Russians | 0.4 /100 | #251 | Tragic 44.0% |
| Seminole | 0.4 /100 | #252 | Tragic 44.0% |
| Central Americans | 0.3 /100 | #253 | Tragic 43.9% |
| Apache | 0.3 /100 | #254 | Tragic 43.9% |
| Shoshone | 0.3 /100 | #255 | Tragic 43.9% |
| Ugandans | 0.3 /100 | #256 | Tragic 43.8% |
| Blackfeet | 0.2 /100 | #257 | Tragic 43.8% |
| Central American Indians | 0.2 /100 | #258 | Tragic 43.8% |
| Iroquois | 0.2 /100 | #259 | Tragic 43.7% |
| Immigrants | Cameroon | 0.2 /100 | #260 | Tragic 43.7% |
| Alaskan Athabascans | 0.2 /100 | #261 | Tragic 43.6% |
| Vietnamese | 0.2 /100 | #262 | Tragic 43.6% |
| Cree | 0.1 /100 | #263 | Tragic 43.6% |
| Bangladeshis | 0.1 /100 | #264 | Tragic 43.5% |
| Moroccans | 0.1 /100 | #265 | Tragic 43.5% |
| Ecuadorians | 0.1 /100 | #266 | Tragic 43.5% |
| Natives/Alaskans | 0.1 /100 | #267 | Tragic 43.5% |