Ecuadorian vs Nigerian 3 or more Vehicles in Household
COMPARE
Ecuadorian
Nigerian
3 or more Vehicles in Household
3 or more Vehicles in Household Comparison
Ecuadorians
Nigerians
14.1%
3 OR MORE VEHICLES IN HOUSEHOLD
0.0/ 100
METRIC RATING
327th/ 347
METRIC RANK
18.6%
3 OR MORE VEHICLES IN HOUSEHOLD
7.9/ 100
METRIC RATING
220th/ 347
METRIC RANK
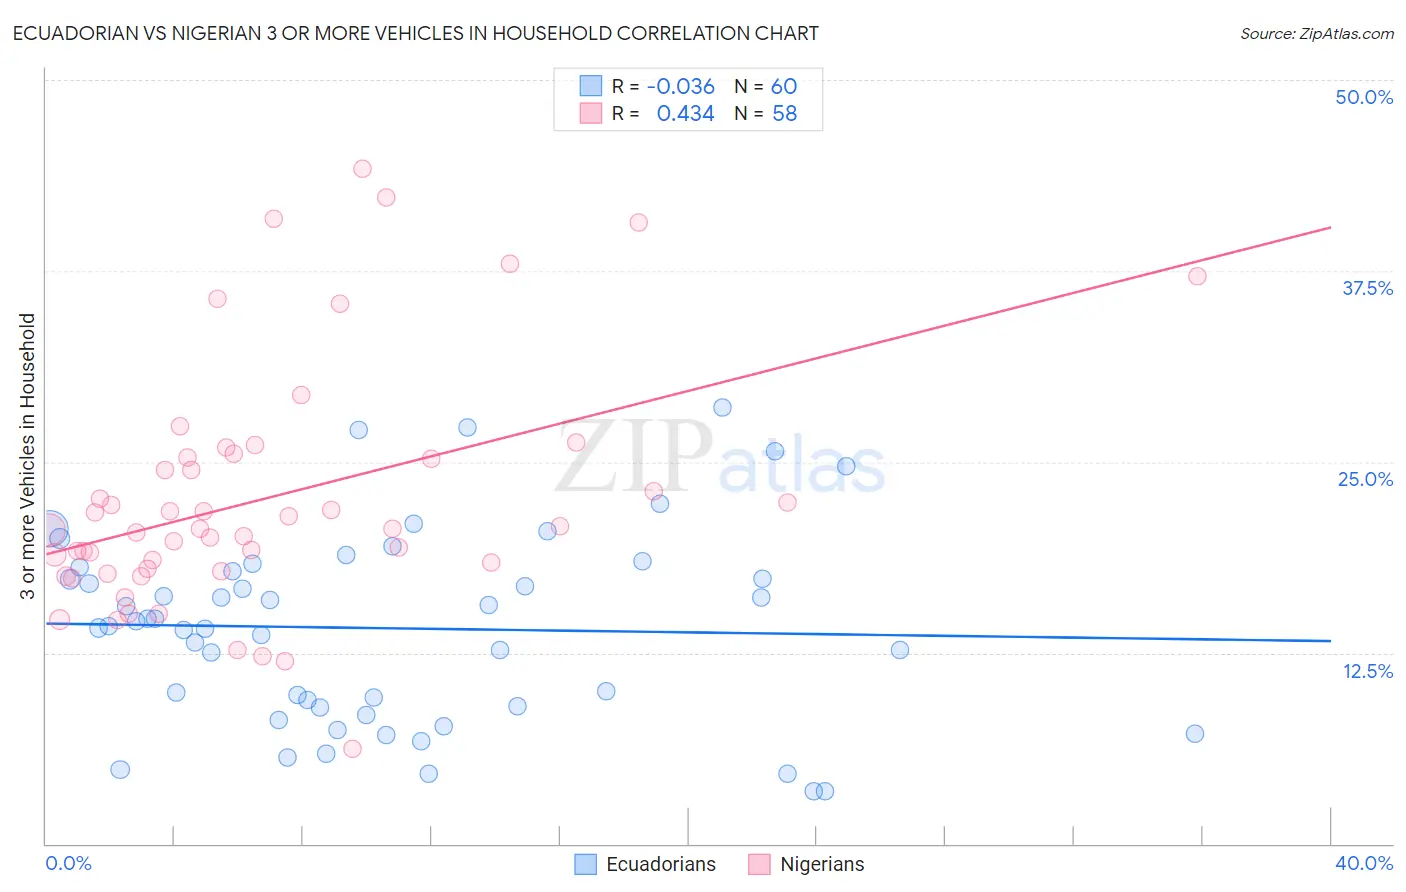
Ecuadorian vs Nigerian 3 or more Vehicles in Household Correlation Chart
The statistical analysis conducted on geographies consisting of 317,505,117 people shows no correlation between the proportion of Ecuadorians and percentage of households with 3 or more vehicles available in the United States with a correlation coefficient (R) of -0.036 and weighted average of 14.1%. Similarly, the statistical analysis conducted on geographies consisting of 332,356,367 people shows a moderate positive correlation between the proportion of Nigerians and percentage of households with 3 or more vehicles available in the United States with a correlation coefficient (R) of 0.434 and weighted average of 18.6%, a difference of 32.3%.
3 or more Vehicles in Household Correlation Summary
| Measurement | Ecuadorian | Nigerian |
| Minimum | 3.4% | 6.2% |
| Maximum | 28.5% | 44.2% |
| Range | 25.1% | 37.9% |
| Mean | 14.1% | 22.6% |
| Median | 14.4% | 20.6% |
| Interquartile 25% (IQ1) | 8.9% | 18.0% |
| Interquartile 75% (IQ3) | 18.0% | 25.3% |
| Interquartile Range (IQR) | 9.1% | 7.3% |
| Standard Deviation (Sample) | 6.3% | 7.9% |
| Standard Deviation (Population) | 6.2% | 7.9% |
Similar Demographics by 3 or more Vehicles in Household
Demographics Similar to Ecuadorians by 3 or more Vehicles in Household
In terms of 3 or more vehicles in household, the demographic groups most similar to Ecuadorians are Immigrants from Albania (14.0%, a difference of 0.71%), Soviet Union (14.2%, a difference of 0.89%), Senegalese (14.2%, a difference of 1.2%), Immigrants from Yemen (14.2%, a difference of 1.3%), and Immigrants from Senegal (13.8%, a difference of 1.9%).
| Demographics | Rating | Rank | 3 or more Vehicles in Household |
| Yup'ik | 0.0 /100 | #320 | Tragic 14.8% |
| Immigrants | Jamaica | 0.0 /100 | #321 | Tragic 14.7% |
| Immigrants | West Indies | 0.0 /100 | #322 | Tragic 14.6% |
| Immigrants | Caribbean | 0.0 /100 | #323 | Tragic 14.6% |
| Immigrants | Yemen | 0.0 /100 | #324 | Tragic 14.2% |
| Senegalese | 0.0 /100 | #325 | Tragic 14.2% |
| Soviet Union | 0.0 /100 | #326 | Tragic 14.2% |
| Ecuadorians | 0.0 /100 | #327 | Tragic 14.1% |
| Immigrants | Albania | 0.0 /100 | #328 | Tragic 14.0% |
| Immigrants | Senegal | 0.0 /100 | #329 | Tragic 13.8% |
| West Indians | 0.0 /100 | #330 | Tragic 13.7% |
| Immigrants | Dominica | 0.0 /100 | #331 | Tragic 13.7% |
| Trinidadians and Tobagonians | 0.0 /100 | #332 | Tragic 13.6% |
| Immigrants | Cabo Verde | 0.0 /100 | #333 | Tragic 13.6% |
| Immigrants | Ecuador | 0.0 /100 | #334 | Tragic 13.4% |
Demographics Similar to Nigerians by 3 or more Vehicles in Household
In terms of 3 or more vehicles in household, the demographic groups most similar to Nigerians are Immigrants from Poland (18.6%, a difference of 0.090%), Belizean (18.6%, a difference of 0.15%), Immigrants from Armenia (18.6%, a difference of 0.20%), Immigrants from Portugal (18.6%, a difference of 0.28%), and Immigrants from Italy (18.7%, a difference of 0.57%).
| Demographics | Rating | Rank | 3 or more Vehicles in Household |
| Immigrants | Cuba | 11.6 /100 | #213 | Poor 18.8% |
| Immigrants | Sierra Leone | 10.8 /100 | #214 | Poor 18.7% |
| Eastern Europeans | 10.6 /100 | #215 | Poor 18.7% |
| Immigrants | Nigeria | 10.3 /100 | #216 | Poor 18.7% |
| Immigrants | Italy | 10.2 /100 | #217 | Poor 18.7% |
| Immigrants | Portugal | 8.9 /100 | #218 | Tragic 18.6% |
| Immigrants | Armenia | 8.6 /100 | #219 | Tragic 18.6% |
| Nigerians | 7.9 /100 | #220 | Tragic 18.6% |
| Immigrants | Poland | 7.5 /100 | #221 | Tragic 18.6% |
| Belizeans | 7.3 /100 | #222 | Tragic 18.6% |
| Immigrants | Czechoslovakia | 5.9 /100 | #223 | Tragic 18.5% |
| Immigrants | Argentina | 5.6 /100 | #224 | Tragic 18.5% |
| Immigrants | Lithuania | 5.6 /100 | #225 | Tragic 18.5% |
| Immigrants | Hungary | 5.5 /100 | #226 | Tragic 18.5% |
| Immigrants | Singapore | 5.4 /100 | #227 | Tragic 18.4% |