Ecuadorian vs Immigrants from Eastern Europe 3 or more Vehicles in Household
COMPARE
Ecuadorian
Immigrants from Eastern Europe
3 or more Vehicles in Household
3 or more Vehicles in Household Comparison
Ecuadorians
Immigrants from Eastern Europe
14.1%
3 OR MORE VEHICLES IN HOUSEHOLD
0.0/ 100
METRIC RATING
327th/ 347
METRIC RANK
17.4%
3 OR MORE VEHICLES IN HOUSEHOLD
0.3/ 100
METRIC RATING
280th/ 347
METRIC RANK
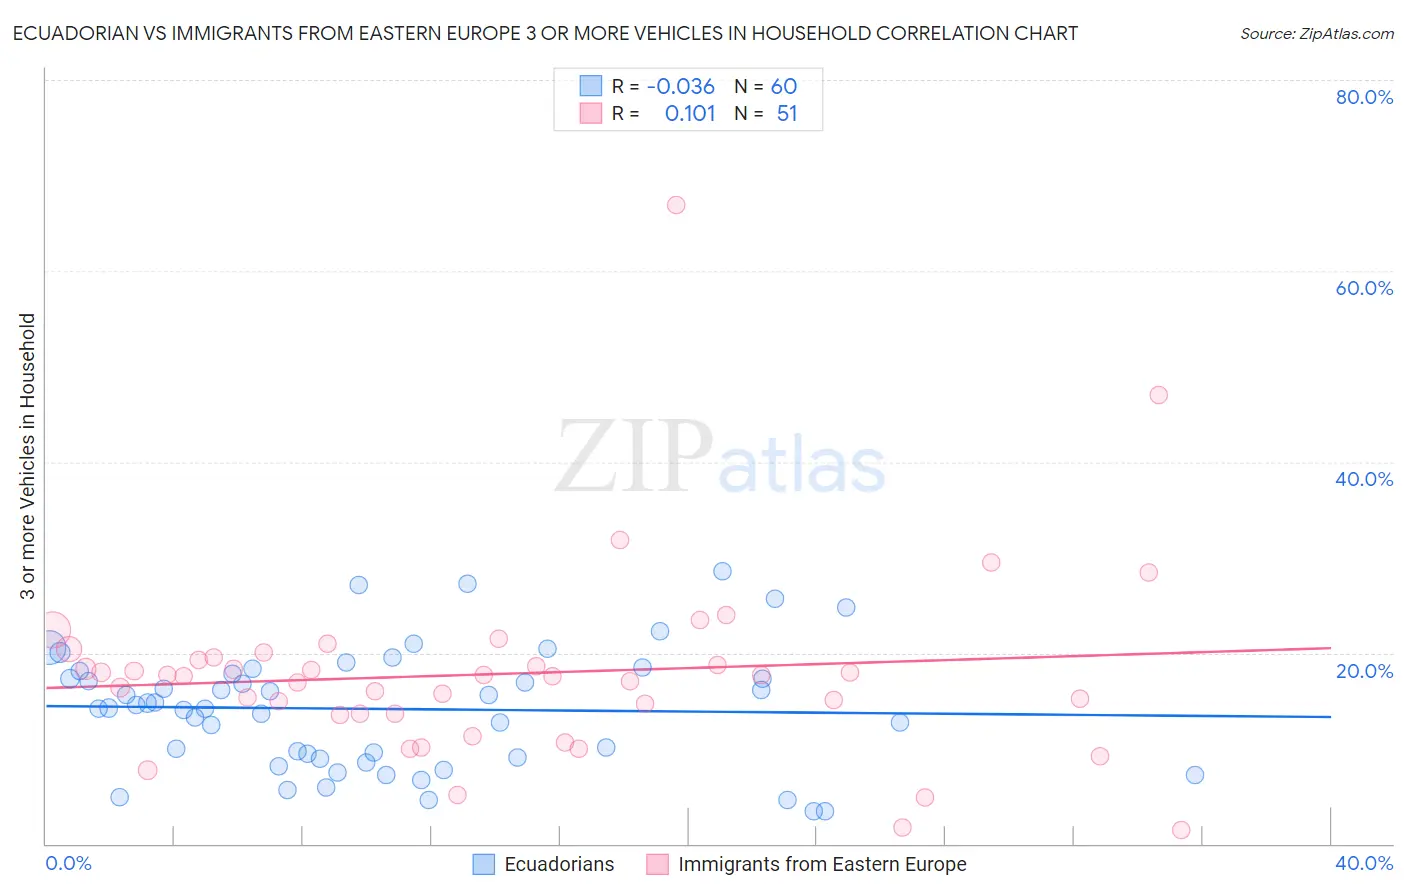
Ecuadorian vs Immigrants from Eastern Europe 3 or more Vehicles in Household Correlation Chart
The statistical analysis conducted on geographies consisting of 317,505,117 people shows no correlation between the proportion of Ecuadorians and percentage of households with 3 or more vehicles available in the United States with a correlation coefficient (R) of -0.036 and weighted average of 14.1%. Similarly, the statistical analysis conducted on geographies consisting of 475,306,541 people shows a poor positive correlation between the proportion of Immigrants from Eastern Europe and percentage of households with 3 or more vehicles available in the United States with a correlation coefficient (R) of 0.101 and weighted average of 17.4%, a difference of 23.8%.
3 or more Vehicles in Household Correlation Summary
| Measurement | Ecuadorian | Immigrants from Eastern Europe |
| Minimum | 3.4% | 1.4% |
| Maximum | 28.5% | 66.9% |
| Range | 25.1% | 65.5% |
| Mean | 14.1% | 17.8% |
| Median | 14.4% | 17.6% |
| Interquartile 25% (IQ1) | 8.9% | 13.6% |
| Interquartile 75% (IQ3) | 18.0% | 19.5% |
| Interquartile Range (IQR) | 9.1% | 5.9% |
| Standard Deviation (Sample) | 6.3% | 10.3% |
| Standard Deviation (Population) | 6.2% | 10.2% |
Similar Demographics by 3 or more Vehicles in Household
Demographics Similar to Ecuadorians by 3 or more Vehicles in Household
In terms of 3 or more vehicles in household, the demographic groups most similar to Ecuadorians are Immigrants from Albania (14.0%, a difference of 0.71%), Soviet Union (14.2%, a difference of 0.89%), Senegalese (14.2%, a difference of 1.2%), Immigrants from Yemen (14.2%, a difference of 1.3%), and Immigrants from Senegal (13.8%, a difference of 1.9%).
| Demographics | Rating | Rank | 3 or more Vehicles in Household |
| Yup'ik | 0.0 /100 | #320 | Tragic 14.8% |
| Immigrants | Jamaica | 0.0 /100 | #321 | Tragic 14.7% |
| Immigrants | West Indies | 0.0 /100 | #322 | Tragic 14.6% |
| Immigrants | Caribbean | 0.0 /100 | #323 | Tragic 14.6% |
| Immigrants | Yemen | 0.0 /100 | #324 | Tragic 14.2% |
| Senegalese | 0.0 /100 | #325 | Tragic 14.2% |
| Soviet Union | 0.0 /100 | #326 | Tragic 14.2% |
| Ecuadorians | 0.0 /100 | #327 | Tragic 14.1% |
| Immigrants | Albania | 0.0 /100 | #328 | Tragic 14.0% |
| Immigrants | Senegal | 0.0 /100 | #329 | Tragic 13.8% |
| West Indians | 0.0 /100 | #330 | Tragic 13.7% |
| Immigrants | Dominica | 0.0 /100 | #331 | Tragic 13.7% |
| Trinidadians and Tobagonians | 0.0 /100 | #332 | Tragic 13.6% |
| Immigrants | Cabo Verde | 0.0 /100 | #333 | Tragic 13.6% |
| Immigrants | Ecuador | 0.0 /100 | #334 | Tragic 13.4% |
Demographics Similar to Immigrants from Eastern Europe by 3 or more Vehicles in Household
In terms of 3 or more vehicles in household, the demographic groups most similar to Immigrants from Eastern Europe are Immigrants from Kazakhstan (17.4%, a difference of 0.040%), Immigrants from Latvia (17.4%, a difference of 0.040%), Immigrants from Bahamas (17.4%, a difference of 0.050%), Brazilian (17.4%, a difference of 0.14%), and Okinawan (17.4%, a difference of 0.29%).
| Demographics | Rating | Rank | 3 or more Vehicles in Household |
| Immigrants | Sudan | 0.5 /100 | #273 | Tragic 17.6% |
| Immigrants | Bosnia and Herzegovina | 0.5 /100 | #274 | Tragic 17.5% |
| Immigrants | Ukraine | 0.4 /100 | #275 | Tragic 17.5% |
| Okinawans | 0.4 /100 | #276 | Tragic 17.4% |
| Brazilians | 0.4 /100 | #277 | Tragic 17.4% |
| Immigrants | Bahamas | 0.3 /100 | #278 | Tragic 17.4% |
| Immigrants | Kazakhstan | 0.3 /100 | #279 | Tragic 17.4% |
| Immigrants | Eastern Europe | 0.3 /100 | #280 | Tragic 17.4% |
| Immigrants | Latvia | 0.3 /100 | #281 | Tragic 17.4% |
| Immigrants | Ireland | 0.3 /100 | #282 | Tragic 17.3% |
| Blacks/African Americans | 0.3 /100 | #283 | Tragic 17.3% |
| Immigrants | Colombia | 0.3 /100 | #284 | Tragic 17.3% |
| Immigrants | Croatia | 0.2 /100 | #285 | Tragic 17.2% |
| Menominee | 0.2 /100 | #286 | Tragic 17.2% |
| Immigrants | Brazil | 0.2 /100 | #287 | Tragic 17.1% |