Chippewa vs Ugandan 2 or more Vehicles in Household
COMPARE
Chippewa
Ugandan
2 or more Vehicles in Household
2 or more Vehicles in Household Comparison
Chippewa
Ugandans
57.2%
2 OR MORE VEHICLES IN HOUSEHOLD
96.6/ 100
METRIC RATING
115th/ 347
METRIC RANK
53.5%
2 OR MORE VEHICLES IN HOUSEHOLD
3.2/ 100
METRIC RATING
233rd/ 347
METRIC RANK
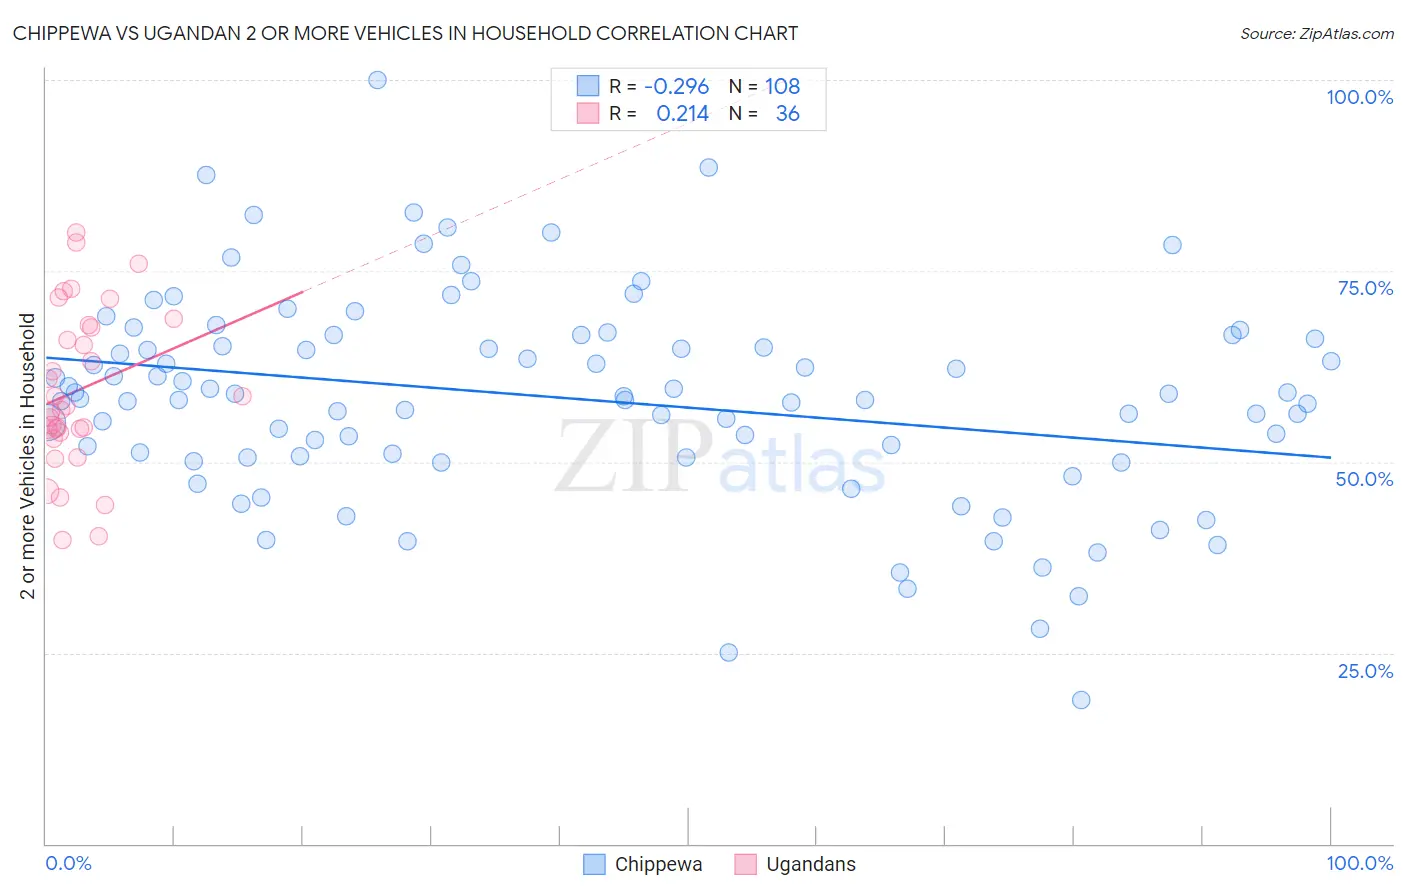
Chippewa vs Ugandan 2 or more Vehicles in Household Correlation Chart
The statistical analysis conducted on geographies consisting of 215,015,237 people shows a weak negative correlation between the proportion of Chippewa and percentage of households with 2 or more vehicles available in the United States with a correlation coefficient (R) of -0.296 and weighted average of 57.2%. Similarly, the statistical analysis conducted on geographies consisting of 93,998,632 people shows a weak positive correlation between the proportion of Ugandans and percentage of households with 2 or more vehicles available in the United States with a correlation coefficient (R) of 0.214 and weighted average of 53.5%, a difference of 7.0%.
2 or more Vehicles in Household Correlation Summary
| Measurement | Chippewa | Ugandan |
| Minimum | 18.9% | 39.7% |
| Maximum | 100.0% | 80.0% |
| Range | 81.1% | 40.3% |
| Mean | 58.3% | 59.4% |
| Median | 58.5% | 57.0% |
| Interquartile 25% (IQ1) | 50.7% | 54.0% |
| Interquartile 75% (IQ3) | 66.4% | 67.8% |
| Interquartile Range (IQR) | 15.7% | 13.8% |
| Standard Deviation (Sample) | 13.7% | 10.4% |
| Standard Deviation (Population) | 13.7% | 10.3% |
Similar Demographics by 2 or more Vehicles in Household
Demographics Similar to Chippewa by 2 or more Vehicles in Household
In terms of 2 or more vehicles in household, the demographic groups most similar to Chippewa are Immigrants from Jordan (57.2%, a difference of 0.010%), Immigrants from Lebanon (57.2%, a difference of 0.050%), Zimbabwean (57.2%, a difference of 0.090%), Iraqi (57.1%, a difference of 0.20%), and Asian (57.0%, a difference of 0.37%).
| Demographics | Rating | Rank | 2 or more Vehicles in Household |
| Immigrants | Canada | 98.1 /100 | #108 | Exceptional 57.5% |
| Immigrants | North America | 98.1 /100 | #109 | Exceptional 57.5% |
| Japanese | 98.0 /100 | #110 | Exceptional 57.5% |
| Greeks | 98.0 /100 | #111 | Exceptional 57.5% |
| Pueblo | 98.0 /100 | #112 | Exceptional 57.5% |
| Zimbabweans | 96.9 /100 | #113 | Exceptional 57.2% |
| Immigrants | Lebanon | 96.8 /100 | #114 | Exceptional 57.2% |
| Chippewa | 96.6 /100 | #115 | Exceptional 57.2% |
| Immigrants | Jordan | 96.6 /100 | #116 | Exceptional 57.2% |
| Iraqis | 95.8 /100 | #117 | Exceptional 57.1% |
| Asians | 95.1 /100 | #118 | Exceptional 57.0% |
| Natives/Alaskans | 95.0 /100 | #119 | Exceptional 57.0% |
| Costa Ricans | 94.7 /100 | #120 | Exceptional 56.9% |
| Sioux | 93.8 /100 | #121 | Exceptional 56.8% |
| Immigrants | South Africa | 92.5 /100 | #122 | Exceptional 56.7% |
Demographics Similar to Ugandans by 2 or more Vehicles in Household
In terms of 2 or more vehicles in household, the demographic groups most similar to Ugandans are Immigrants from Guatemala (53.5%, a difference of 0.010%), Immigrants from Switzerland (53.4%, a difference of 0.060%), Panamanian (53.5%, a difference of 0.080%), Immigrants from Middle Africa (53.4%, a difference of 0.090%), and Immigrants from Nepal (53.5%, a difference of 0.13%).
| Demographics | Rating | Rank | 2 or more Vehicles in Household |
| Immigrants | Eastern Africa | 5.1 /100 | #226 | Tragic 53.7% |
| Sudanese | 4.1 /100 | #227 | Tragic 53.6% |
| Alaska Natives | 3.9 /100 | #228 | Tragic 53.6% |
| Immigrants | Turkey | 3.8 /100 | #229 | Tragic 53.6% |
| Immigrants | Nepal | 3.6 /100 | #230 | Tragic 53.5% |
| Panamanians | 3.4 /100 | #231 | Tragic 53.5% |
| Immigrants | Guatemala | 3.2 /100 | #232 | Tragic 53.5% |
| Ugandans | 3.2 /100 | #233 | Tragic 53.5% |
| Immigrants | Switzerland | 3.0 /100 | #234 | Tragic 53.4% |
| Immigrants | Middle Africa | 3.0 /100 | #235 | Tragic 53.4% |
| Indonesians | 2.7 /100 | #236 | Tragic 53.4% |
| Macedonians | 2.4 /100 | #237 | Tragic 53.3% |
| Immigrants | Armenia | 2.3 /100 | #238 | Tragic 53.3% |
| Cambodians | 2.3 /100 | #239 | Tragic 53.3% |
| Immigrants | Europe | 2.1 /100 | #240 | Tragic 53.2% |