Immigrants from Portugal vs Ugandan 2 or more Vehicles in Household
COMPARE
Immigrants from Portugal
Ugandan
2 or more Vehicles in Household
2 or more Vehicles in Household Comparison
Immigrants from Portugal
Ugandans
52.8%
2 OR MORE VEHICLES IN HOUSEHOLD
1.0/ 100
METRIC RATING
252nd/ 347
METRIC RANK
53.5%
2 OR MORE VEHICLES IN HOUSEHOLD
3.2/ 100
METRIC RATING
233rd/ 347
METRIC RANK
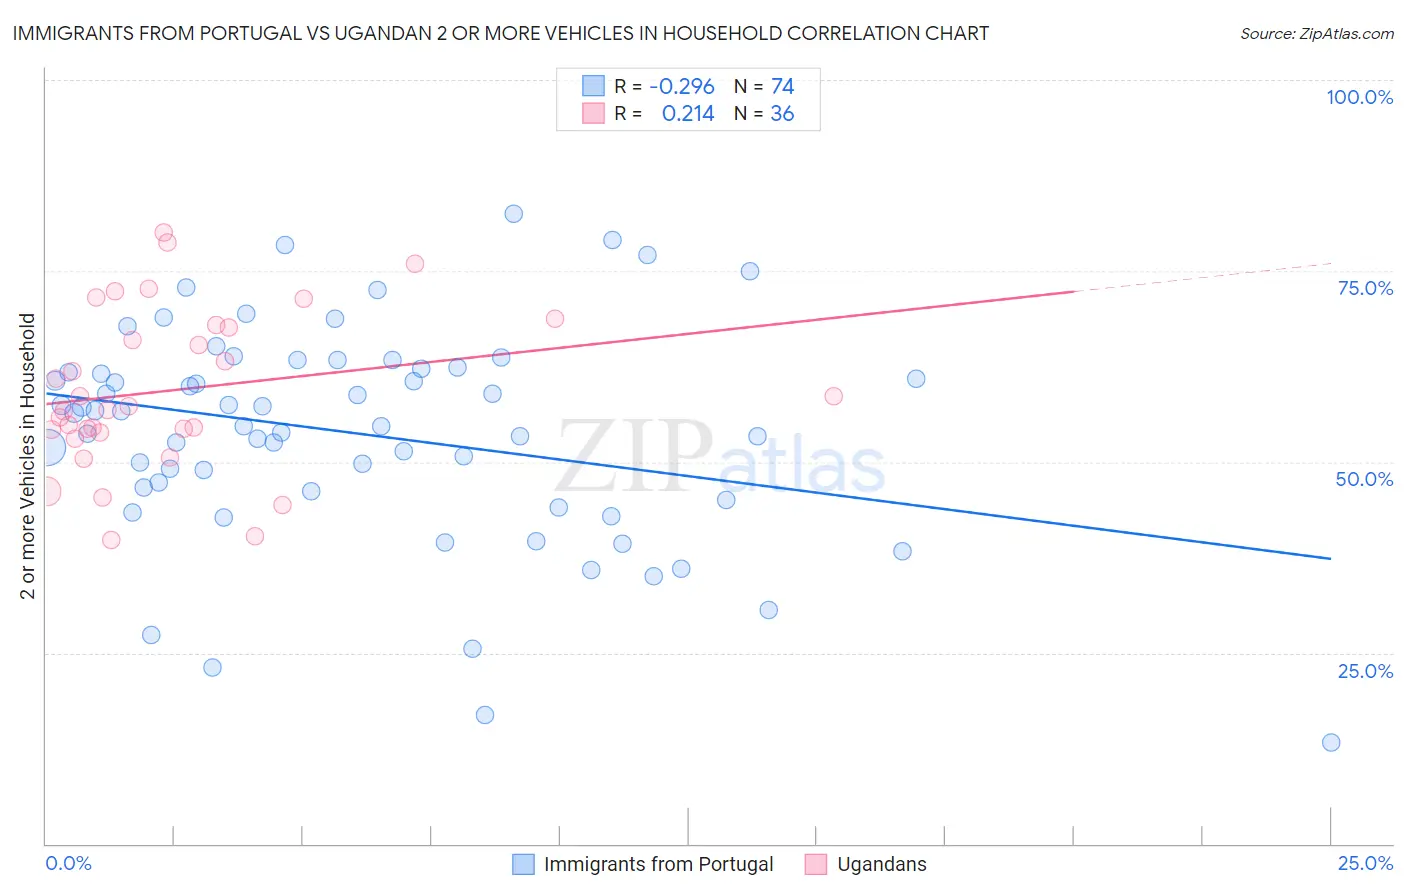
Immigrants from Portugal vs Ugandan 2 or more Vehicles in Household Correlation Chart
The statistical analysis conducted on geographies consisting of 174,767,026 people shows a weak negative correlation between the proportion of Immigrants from Portugal and percentage of households with 2 or more vehicles available in the United States with a correlation coefficient (R) of -0.296 and weighted average of 52.8%. Similarly, the statistical analysis conducted on geographies consisting of 93,998,632 people shows a weak positive correlation between the proportion of Ugandans and percentage of households with 2 or more vehicles available in the United States with a correlation coefficient (R) of 0.214 and weighted average of 53.5%, a difference of 1.3%.
2 or more Vehicles in Household Correlation Summary
| Measurement | Immigrants from Portugal | Ugandan |
| Minimum | 13.2% | 39.7% |
| Maximum | 82.5% | 80.0% |
| Range | 69.3% | 40.3% |
| Mean | 53.7% | 59.4% |
| Median | 55.5% | 57.0% |
| Interquartile 25% (IQ1) | 46.2% | 54.0% |
| Interquartile 75% (IQ3) | 62.2% | 67.8% |
| Interquartile Range (IQR) | 16.0% | 13.8% |
| Standard Deviation (Sample) | 14.1% | 10.4% |
| Standard Deviation (Population) | 14.0% | 10.3% |
Demographics Similar to Immigrants from Portugal and Ugandans by 2 or more Vehicles in Household
In terms of 2 or more vehicles in household, the demographic groups most similar to Immigrants from Portugal are Immigrants from Sudan (52.8%, a difference of 0.010%), Immigrants from Brazil (52.8%, a difference of 0.050%), Mongolian (52.8%, a difference of 0.050%), Colombian (52.9%, a difference of 0.10%), and Sierra Leonean (52.9%, a difference of 0.23%). Similarly, the demographic groups most similar to Ugandans are Immigrants from Guatemala (53.5%, a difference of 0.010%), Immigrants from Switzerland (53.4%, a difference of 0.060%), Immigrants from Middle Africa (53.4%, a difference of 0.090%), Indonesian (53.4%, a difference of 0.18%), and Macedonian (53.3%, a difference of 0.29%).
| Demographics | Rating | Rank | 2 or more Vehicles in Household |
| Immigrants | Guatemala | 3.2 /100 | #232 | Tragic 53.5% |
| Ugandans | 3.2 /100 | #233 | Tragic 53.5% |
| Immigrants | Switzerland | 3.0 /100 | #234 | Tragic 53.4% |
| Immigrants | Middle Africa | 3.0 /100 | #235 | Tragic 53.4% |
| Indonesians | 2.7 /100 | #236 | Tragic 53.4% |
| Macedonians | 2.4 /100 | #237 | Tragic 53.3% |
| Immigrants | Armenia | 2.3 /100 | #238 | Tragic 53.3% |
| Cambodians | 2.3 /100 | #239 | Tragic 53.3% |
| Immigrants | Europe | 2.1 /100 | #240 | Tragic 53.2% |
| Immigrants | Sierra Leone | 2.1 /100 | #241 | Tragic 53.2% |
| Immigrants | Eastern Asia | 2.1 /100 | #242 | Tragic 53.2% |
| Ethiopians | 1.7 /100 | #243 | Tragic 53.1% |
| Indians (Asian) | 1.7 /100 | #244 | Tragic 53.1% |
| Immigrants | Ethiopia | 1.5 /100 | #245 | Tragic 53.0% |
| Immigrants | Nigeria | 1.2 /100 | #246 | Tragic 52.9% |
| Sierra Leoneans | 1.2 /100 | #247 | Tragic 52.9% |
| Colombians | 1.1 /100 | #248 | Tragic 52.9% |
| Immigrants | Brazil | 1.0 /100 | #249 | Tragic 52.8% |
| Mongolians | 1.0 /100 | #250 | Tragic 52.8% |
| Immigrants | Sudan | 1.0 /100 | #251 | Tragic 52.8% |
| Immigrants | Portugal | 1.0 /100 | #252 | Tragic 52.8% |