Chippewa vs Immigrants from Singapore 2 or more Vehicles in Household
COMPARE
Chippewa
Immigrants from Singapore
2 or more Vehicles in Household
2 or more Vehicles in Household Comparison
Chippewa
Immigrants from Singapore
57.2%
2 OR MORE VEHICLES IN HOUSEHOLD
96.6/ 100
METRIC RATING
115th/ 347
METRIC RANK
53.9%
2 OR MORE VEHICLES IN HOUSEHOLD
6.3/ 100
METRIC RATING
221st/ 347
METRIC RANK
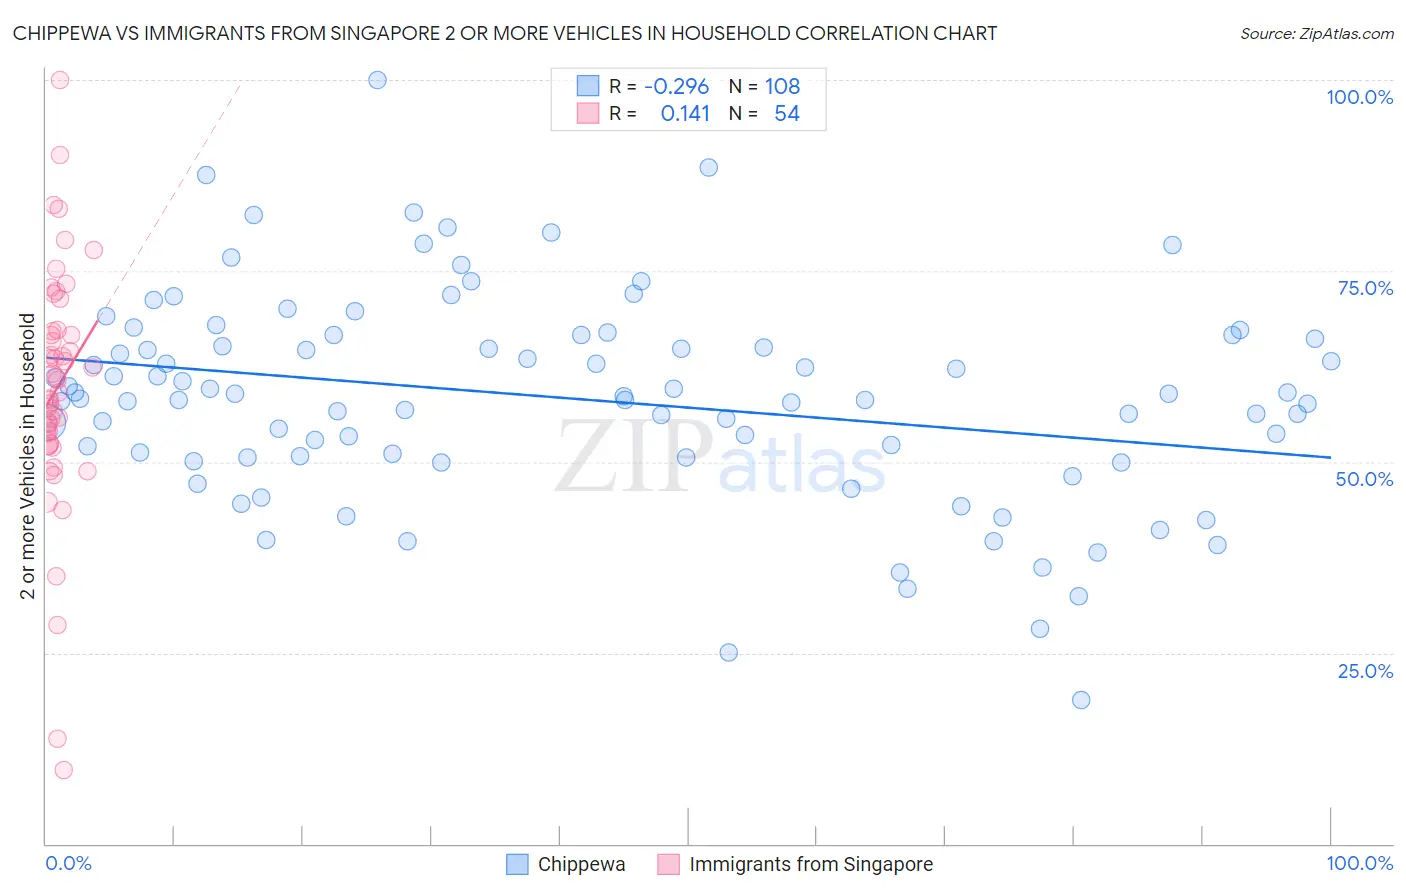
Chippewa vs Immigrants from Singapore 2 or more Vehicles in Household Correlation Chart
The statistical analysis conducted on geographies consisting of 215,015,237 people shows a weak negative correlation between the proportion of Chippewa and percentage of households with 2 or more vehicles available in the United States with a correlation coefficient (R) of -0.296 and weighted average of 57.2%. Similarly, the statistical analysis conducted on geographies consisting of 137,464,640 people shows a poor positive correlation between the proportion of Immigrants from Singapore and percentage of households with 2 or more vehicles available in the United States with a correlation coefficient (R) of 0.141 and weighted average of 53.9%, a difference of 6.2%.
2 or more Vehicles in Household Correlation Summary
| Measurement | Chippewa | Immigrants from Singapore |
| Minimum | 18.9% | 9.7% |
| Maximum | 100.0% | 100.0% |
| Range | 81.1% | 90.3% |
| Mean | 58.3% | 59.7% |
| Median | 58.5% | 59.9% |
| Interquartile 25% (IQ1) | 50.7% | 52.4% |
| Interquartile 75% (IQ3) | 66.4% | 67.1% |
| Interquartile Range (IQR) | 15.7% | 14.6% |
| Standard Deviation (Sample) | 13.7% | 15.9% |
| Standard Deviation (Population) | 13.7% | 15.7% |
Similar Demographics by 2 or more Vehicles in Household
Demographics Similar to Chippewa by 2 or more Vehicles in Household
In terms of 2 or more vehicles in household, the demographic groups most similar to Chippewa are Immigrants from Jordan (57.2%, a difference of 0.010%), Immigrants from Lebanon (57.2%, a difference of 0.050%), Zimbabwean (57.2%, a difference of 0.090%), Iraqi (57.1%, a difference of 0.20%), and Asian (57.0%, a difference of 0.37%).
| Demographics | Rating | Rank | 2 or more Vehicles in Household |
| Immigrants | Canada | 98.1 /100 | #108 | Exceptional 57.5% |
| Immigrants | North America | 98.1 /100 | #109 | Exceptional 57.5% |
| Japanese | 98.0 /100 | #110 | Exceptional 57.5% |
| Greeks | 98.0 /100 | #111 | Exceptional 57.5% |
| Pueblo | 98.0 /100 | #112 | Exceptional 57.5% |
| Zimbabweans | 96.9 /100 | #113 | Exceptional 57.2% |
| Immigrants | Lebanon | 96.8 /100 | #114 | Exceptional 57.2% |
| Chippewa | 96.6 /100 | #115 | Exceptional 57.2% |
| Immigrants | Jordan | 96.6 /100 | #116 | Exceptional 57.2% |
| Iraqis | 95.8 /100 | #117 | Exceptional 57.1% |
| Asians | 95.1 /100 | #118 | Exceptional 57.0% |
| Natives/Alaskans | 95.0 /100 | #119 | Exceptional 57.0% |
| Costa Ricans | 94.7 /100 | #120 | Exceptional 56.9% |
| Sioux | 93.8 /100 | #121 | Exceptional 56.8% |
| Immigrants | South Africa | 92.5 /100 | #122 | Exceptional 56.7% |
Demographics Similar to Immigrants from Singapore by 2 or more Vehicles in Household
In terms of 2 or more vehicles in household, the demographic groups most similar to Immigrants from Singapore are Taiwanese (53.9%, a difference of 0.010%), Kiowa (53.9%, a difference of 0.010%), South American Indian (53.9%, a difference of 0.040%), Immigrants from Argentina (53.9%, a difference of 0.10%), and Immigrants from Burma/Myanmar (53.9%, a difference of 0.14%).
| Demographics | Rating | Rank | 2 or more Vehicles in Household |
| Immigrants | Czechoslovakia | 9.4 /100 | #214 | Tragic 54.1% |
| Aleuts | 9.3 /100 | #215 | Tragic 54.1% |
| Immigrants | Western Asia | 9.3 /100 | #216 | Tragic 54.1% |
| Immigrants | Burma/Myanmar | 7.1 /100 | #217 | Tragic 53.9% |
| Immigrants | Argentina | 6.8 /100 | #218 | Tragic 53.9% |
| South American Indians | 6.5 /100 | #219 | Tragic 53.9% |
| Taiwanese | 6.3 /100 | #220 | Tragic 53.9% |
| Immigrants | Singapore | 6.3 /100 | #221 | Tragic 53.9% |
| Kiowa | 6.2 /100 | #222 | Tragic 53.9% |
| Immigrants | Bosnia and Herzegovina | 5.5 /100 | #223 | Tragic 53.8% |
| Brazilians | 5.3 /100 | #224 | Tragic 53.8% |
| Immigrants | Egypt | 5.2 /100 | #225 | Tragic 53.8% |
| Immigrants | Eastern Africa | 5.1 /100 | #226 | Tragic 53.7% |
| Sudanese | 4.1 /100 | #227 | Tragic 53.6% |
| Alaska Natives | 3.9 /100 | #228 | Tragic 53.6% |