Chippewa vs Ugandan No Schooling Completed
COMPARE
Chippewa
Ugandan
No Schooling Completed
No Schooling Completed Comparison
Chippewa
Ugandans
1.6%
NO SCHOOLING COMPLETED
99.8/ 100
METRIC RATING
51st/ 347
METRIC RANK
2.0%
NO SCHOOLING COMPLETED
64.6/ 100
METRIC RATING
161st/ 347
METRIC RANK
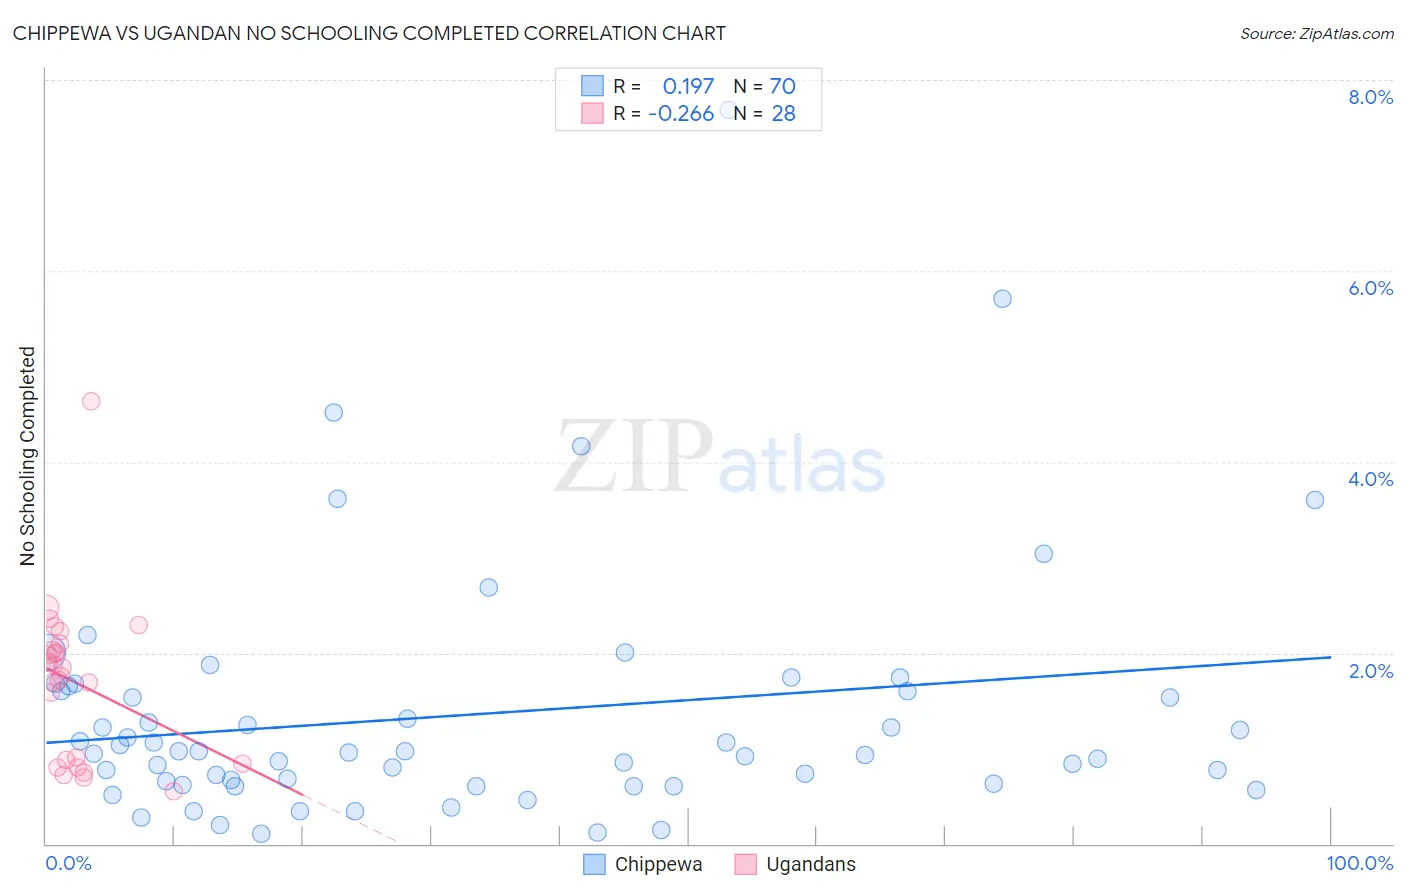
Chippewa vs Ugandan No Schooling Completed Correlation Chart
The statistical analysis conducted on geographies consisting of 212,932,058 people shows a poor positive correlation between the proportion of Chippewa and percentage of population with no schooling in the United States with a correlation coefficient (R) of 0.197 and weighted average of 1.6%. Similarly, the statistical analysis conducted on geographies consisting of 93,762,117 people shows a weak negative correlation between the proportion of Ugandans and percentage of population with no schooling in the United States with a correlation coefficient (R) of -0.266 and weighted average of 2.0%, a difference of 25.3%.
No Schooling Completed Correlation Summary
| Measurement | Chippewa | Ugandan |
| Minimum | 0.10% | 0.56% |
| Maximum | 7.7% | 4.6% |
| Range | 7.6% | 4.1% |
| Mean | 1.4% | 1.7% |
| Median | 0.96% | 1.8% |
| Interquartile 25% (IQ1) | 0.63% | 0.85% |
| Interquartile 75% (IQ3) | 1.6% | 2.1% |
| Interquartile Range (IQR) | 0.96% | 1.2% |
| Standard Deviation (Sample) | 1.3% | 0.84% |
| Standard Deviation (Population) | 1.3% | 0.83% |
Similar Demographics by No Schooling Completed
Demographics Similar to Chippewa by No Schooling Completed
In terms of no schooling completed, the demographic groups most similar to Chippewa are Immigrants from Canada (1.6%, a difference of 0.070%), Celtic (1.6%, a difference of 0.20%), Creek (1.6%, a difference of 0.20%), Crow (1.6%, a difference of 0.23%), and White/Caucasian (1.6%, a difference of 0.34%).
| Demographics | Rating | Rank | No Schooling Completed |
| Estonians | 99.9 /100 | #44 | Exceptional 1.6% |
| Czechoslovakians | 99.9 /100 | #45 | Exceptional 1.6% |
| Maltese | 99.9 /100 | #46 | Exceptional 1.6% |
| Ottawa | 99.9 /100 | #47 | Exceptional 1.6% |
| Immigrants | Scotland | 99.9 /100 | #48 | Exceptional 1.6% |
| Whites/Caucasians | 99.9 /100 | #49 | Exceptional 1.6% |
| Celtics | 99.9 /100 | #50 | Exceptional 1.6% |
| Chippewa | 99.8 /100 | #51 | Exceptional 1.6% |
| Immigrants | Canada | 99.8 /100 | #52 | Exceptional 1.6% |
| Creek | 99.8 /100 | #53 | Exceptional 1.6% |
| Crow | 99.8 /100 | #54 | Exceptional 1.6% |
| Greeks | 99.8 /100 | #55 | Exceptional 1.6% |
| Immigrants | North America | 99.8 /100 | #56 | Exceptional 1.6% |
| Austrians | 99.8 /100 | #57 | Exceptional 1.6% |
| Kiowa | 99.8 /100 | #58 | Exceptional 1.6% |
Demographics Similar to Ugandans by No Schooling Completed
In terms of no schooling completed, the demographic groups most similar to Ugandans are Immigrants from Brazil (2.1%, a difference of 0.11%), Kenyan (2.0%, a difference of 0.17%), Immigrants from Spain (2.0%, a difference of 0.29%), Immigrants from Korea (2.0%, a difference of 0.33%), and Albanian (2.1%, a difference of 0.35%).
| Demographics | Rating | Rank | No Schooling Completed |
| Immigrants | Venezuela | 68.5 /100 | #154 | Good 2.0% |
| Immigrants | Russia | 67.6 /100 | #155 | Good 2.0% |
| Chileans | 67.2 /100 | #156 | Good 2.0% |
| Immigrants | Sri Lanka | 67.0 /100 | #157 | Good 2.0% |
| Immigrants | Korea | 66.7 /100 | #158 | Good 2.0% |
| Immigrants | Spain | 66.4 /100 | #159 | Good 2.0% |
| Kenyans | 65.7 /100 | #160 | Good 2.0% |
| Ugandans | 64.6 /100 | #161 | Good 2.0% |
| Immigrants | Brazil | 63.8 /100 | #162 | Good 2.1% |
| Albanians | 62.2 /100 | #163 | Good 2.1% |
| Comanche | 60.7 /100 | #164 | Good 2.1% |
| Brazilians | 60.2 /100 | #165 | Good 2.1% |
| Dutch West Indians | 59.9 /100 | #166 | Average 2.1% |
| Egyptians | 59.2 /100 | #167 | Average 2.1% |
| Cheyenne | 58.6 /100 | #168 | Average 2.1% |