Chippewa vs Immigrants from Bangladesh 2 or more Vehicles in Household
COMPARE
Chippewa
Immigrants from Bangladesh
2 or more Vehicles in Household
2 or more Vehicles in Household Comparison
Chippewa
Immigrants from Bangladesh
57.2%
2 OR MORE VEHICLES IN HOUSEHOLD
96.6/ 100
METRIC RATING
115th/ 347
METRIC RANK
38.8%
2 OR MORE VEHICLES IN HOUSEHOLD
0.0/ 100
METRIC RATING
335th/ 347
METRIC RANK
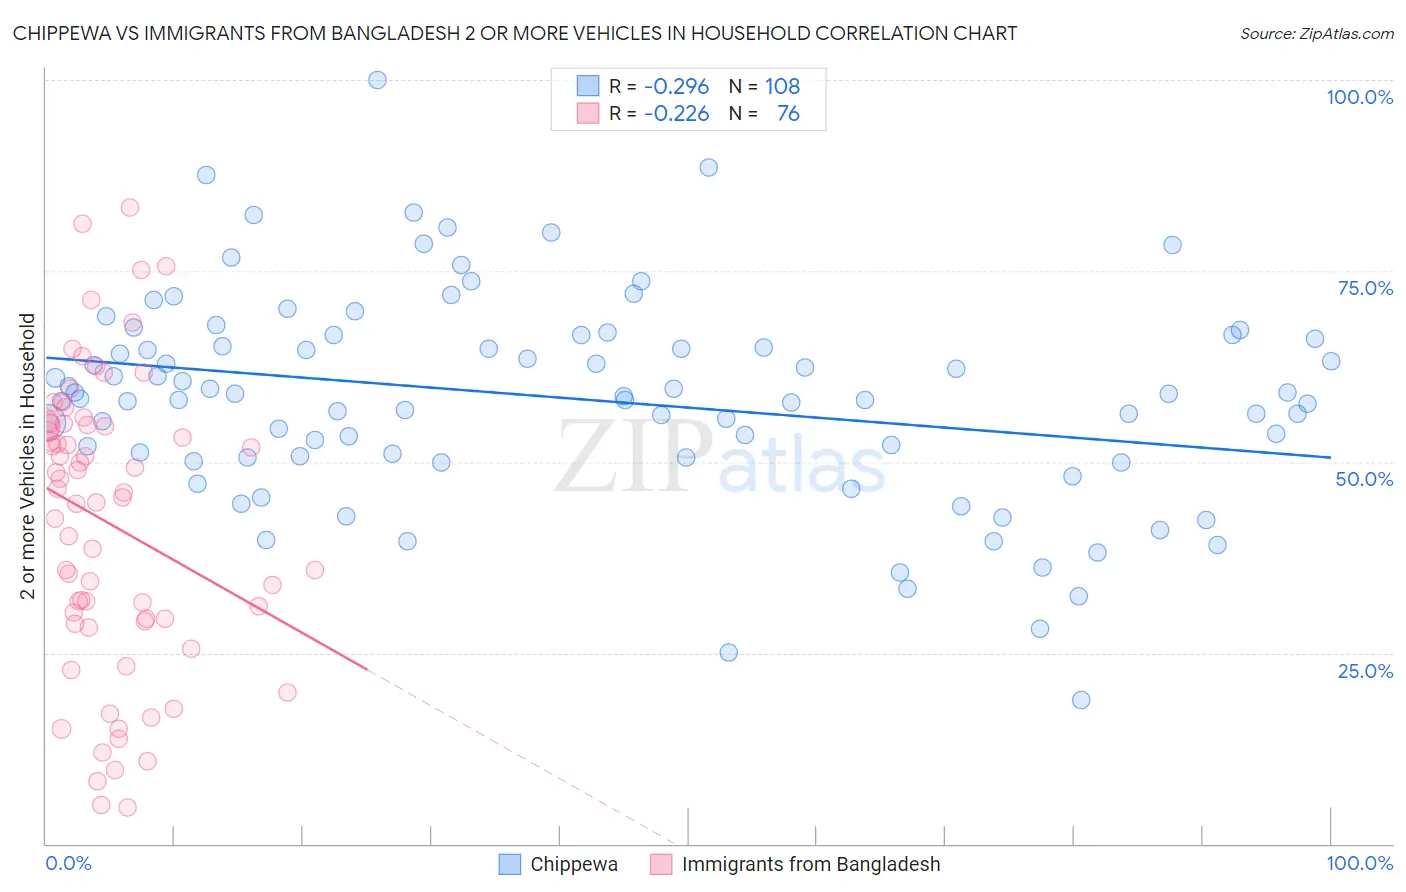
Chippewa vs Immigrants from Bangladesh 2 or more Vehicles in Household Correlation Chart
The statistical analysis conducted on geographies consisting of 215,015,237 people shows a weak negative correlation between the proportion of Chippewa and percentage of households with 2 or more vehicles available in the United States with a correlation coefficient (R) of -0.296 and weighted average of 57.2%. Similarly, the statistical analysis conducted on geographies consisting of 203,599,263 people shows a weak negative correlation between the proportion of Immigrants from Bangladesh and percentage of households with 2 or more vehicles available in the United States with a correlation coefficient (R) of -0.226 and weighted average of 38.8%, a difference of 47.5%.
2 or more Vehicles in Household Correlation Summary
| Measurement | Chippewa | Immigrants from Bangladesh |
| Minimum | 18.9% | 4.7% |
| Maximum | 100.0% | 83.3% |
| Range | 81.1% | 78.7% |
| Mean | 58.3% | 42.0% |
| Median | 58.5% | 45.6% |
| Interquartile 25% (IQ1) | 50.7% | 29.2% |
| Interquartile 75% (IQ3) | 66.4% | 54.9% |
| Interquartile Range (IQR) | 15.7% | 25.7% |
| Standard Deviation (Sample) | 13.7% | 18.9% |
| Standard Deviation (Population) | 13.7% | 18.8% |
Similar Demographics by 2 or more Vehicles in Household
Demographics Similar to Chippewa by 2 or more Vehicles in Household
In terms of 2 or more vehicles in household, the demographic groups most similar to Chippewa are Immigrants from Jordan (57.2%, a difference of 0.010%), Immigrants from Lebanon (57.2%, a difference of 0.050%), Zimbabwean (57.2%, a difference of 0.090%), Iraqi (57.1%, a difference of 0.20%), and Asian (57.0%, a difference of 0.37%).
| Demographics | Rating | Rank | 2 or more Vehicles in Household |
| Immigrants | Canada | 98.1 /100 | #108 | Exceptional 57.5% |
| Immigrants | North America | 98.1 /100 | #109 | Exceptional 57.5% |
| Japanese | 98.0 /100 | #110 | Exceptional 57.5% |
| Greeks | 98.0 /100 | #111 | Exceptional 57.5% |
| Pueblo | 98.0 /100 | #112 | Exceptional 57.5% |
| Zimbabweans | 96.9 /100 | #113 | Exceptional 57.2% |
| Immigrants | Lebanon | 96.8 /100 | #114 | Exceptional 57.2% |
| Chippewa | 96.6 /100 | #115 | Exceptional 57.2% |
| Immigrants | Jordan | 96.6 /100 | #116 | Exceptional 57.2% |
| Iraqis | 95.8 /100 | #117 | Exceptional 57.1% |
| Asians | 95.1 /100 | #118 | Exceptional 57.0% |
| Natives/Alaskans | 95.0 /100 | #119 | Exceptional 57.0% |
| Costa Ricans | 94.7 /100 | #120 | Exceptional 56.9% |
| Sioux | 93.8 /100 | #121 | Exceptional 56.8% |
| Immigrants | South Africa | 92.5 /100 | #122 | Exceptional 56.7% |
Demographics Similar to Immigrants from Bangladesh by 2 or more Vehicles in Household
In terms of 2 or more vehicles in household, the demographic groups most similar to Immigrants from Bangladesh are Vietnamese (38.5%, a difference of 0.72%), Barbadian (38.3%, a difference of 1.1%), Immigrants from Uzbekistan (37.9%, a difference of 2.3%), Immigrants from Trinidad and Tobago (40.3%, a difference of 3.9%), and Immigrants from Ecuador (40.5%, a difference of 4.5%).
| Demographics | Rating | Rank | 2 or more Vehicles in Household |
| Inupiat | 0.0 /100 | #328 | Tragic 42.6% |
| Ecuadorians | 0.0 /100 | #329 | Tragic 42.0% |
| Immigrants | Dominica | 0.0 /100 | #330 | Tragic 41.6% |
| West Indians | 0.0 /100 | #331 | Tragic 41.3% |
| Trinidadians and Tobagonians | 0.0 /100 | #332 | Tragic 40.9% |
| Immigrants | Ecuador | 0.0 /100 | #333 | Tragic 40.5% |
| Immigrants | Trinidad and Tobago | 0.0 /100 | #334 | Tragic 40.3% |
| Immigrants | Bangladesh | 0.0 /100 | #335 | Tragic 38.8% |
| Vietnamese | 0.0 /100 | #336 | Tragic 38.5% |
| Barbadians | 0.0 /100 | #337 | Tragic 38.3% |
| Immigrants | Uzbekistan | 0.0 /100 | #338 | Tragic 37.9% |
| Immigrants | Barbados | 0.0 /100 | #339 | Tragic 35.8% |
| British West Indians | 0.0 /100 | #340 | Tragic 35.4% |
| Guyanese | 0.0 /100 | #341 | Tragic 35.4% |
| Dominicans | 0.0 /100 | #342 | Tragic 35.3% |