Immigrants from Costa Rica vs Ugandan 2 or more Vehicles in Household
COMPARE
Immigrants from Costa Rica
Ugandan
2 or more Vehicles in Household
2 or more Vehicles in Household Comparison
Immigrants from Costa Rica
Ugandans
55.4%
2 OR MORE VEHICLES IN HOUSEHOLD
54.4/ 100
METRIC RATING
171st/ 347
METRIC RANK
53.5%
2 OR MORE VEHICLES IN HOUSEHOLD
3.2/ 100
METRIC RATING
233rd/ 347
METRIC RANK
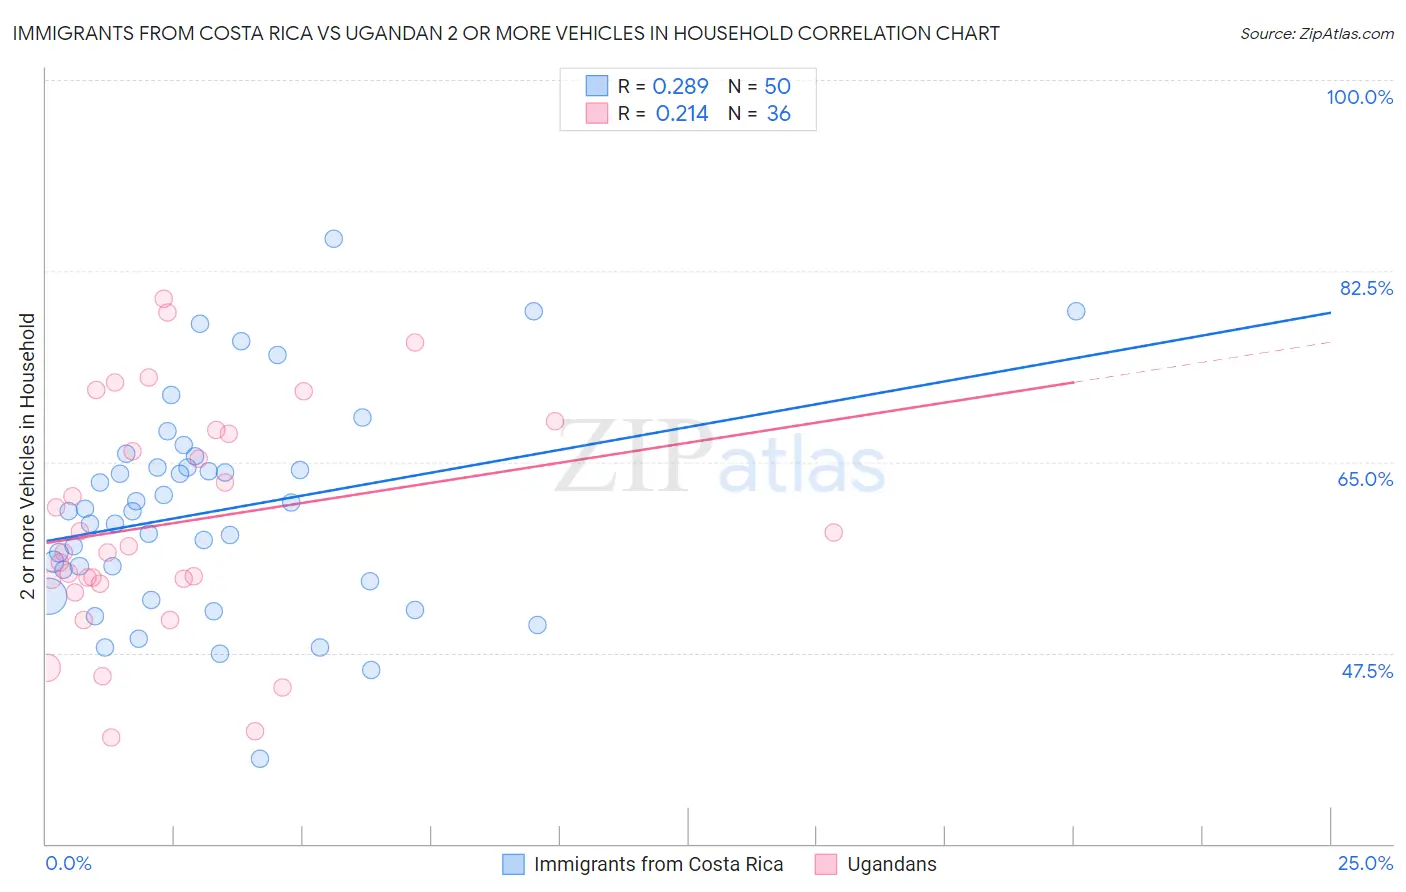
Immigrants from Costa Rica vs Ugandan 2 or more Vehicles in Household Correlation Chart
The statistical analysis conducted on geographies consisting of 204,253,183 people shows a weak positive correlation between the proportion of Immigrants from Costa Rica and percentage of households with 2 or more vehicles available in the United States with a correlation coefficient (R) of 0.289 and weighted average of 55.4%. Similarly, the statistical analysis conducted on geographies consisting of 93,998,632 people shows a weak positive correlation between the proportion of Ugandans and percentage of households with 2 or more vehicles available in the United States with a correlation coefficient (R) of 0.214 and weighted average of 53.5%, a difference of 3.7%.
2 or more Vehicles in Household Correlation Summary
| Measurement | Immigrants from Costa Rica | Ugandan |
| Minimum | 37.8% | 39.7% |
| Maximum | 85.4% | 80.0% |
| Range | 47.6% | 40.3% |
| Mean | 60.5% | 59.4% |
| Median | 60.4% | 57.0% |
| Interquartile 25% (IQ1) | 54.1% | 54.0% |
| Interquartile 75% (IQ3) | 64.4% | 67.8% |
| Interquartile Range (IQR) | 10.4% | 13.8% |
| Standard Deviation (Sample) | 9.6% | 10.4% |
| Standard Deviation (Population) | 9.5% | 10.3% |
Similar Demographics by 2 or more Vehicles in Household
Demographics Similar to Immigrants from Costa Rica by 2 or more Vehicles in Household
In terms of 2 or more vehicles in household, the demographic groups most similar to Immigrants from Costa Rica are Romanian (55.5%, a difference of 0.060%), Immigrants from Austria (55.5%, a difference of 0.080%), French American Indian (55.5%, a difference of 0.090%), Immigrants from Nicaragua (55.4%, a difference of 0.11%), and Immigrants from Western Europe (55.4%, a difference of 0.12%).
| Demographics | Rating | Rank | 2 or more Vehicles in Household |
| Dutch West Indians | 59.8 /100 | #164 | Average 55.6% |
| Immigrants | El Salvador | 59.4 /100 | #165 | Average 55.6% |
| Immigrants | Sri Lanka | 58.3 /100 | #166 | Average 55.5% |
| Kenyans | 58.1 /100 | #167 | Average 55.5% |
| French American Indians | 56.7 /100 | #168 | Average 55.5% |
| Immigrants | Austria | 56.3 /100 | #169 | Average 55.5% |
| Romanians | 55.8 /100 | #170 | Average 55.5% |
| Immigrants | Costa Rica | 54.4 /100 | #171 | Average 55.4% |
| Immigrants | Nicaragua | 51.6 /100 | #172 | Average 55.4% |
| Immigrants | Western Europe | 51.4 /100 | #173 | Average 55.4% |
| Navajo | 50.0 /100 | #174 | Average 55.3% |
| Immigrants | Denmark | 49.4 /100 | #175 | Average 55.3% |
| Immigrants | Cuba | 47.0 /100 | #176 | Average 55.3% |
| Menominee | 46.2 /100 | #177 | Average 55.3% |
| Immigrants | Sweden | 45.3 /100 | #178 | Average 55.2% |
Demographics Similar to Ugandans by 2 or more Vehicles in Household
In terms of 2 or more vehicles in household, the demographic groups most similar to Ugandans are Immigrants from Guatemala (53.5%, a difference of 0.010%), Immigrants from Switzerland (53.4%, a difference of 0.060%), Panamanian (53.5%, a difference of 0.080%), Immigrants from Middle Africa (53.4%, a difference of 0.090%), and Immigrants from Nepal (53.5%, a difference of 0.13%).
| Demographics | Rating | Rank | 2 or more Vehicles in Household |
| Immigrants | Eastern Africa | 5.1 /100 | #226 | Tragic 53.7% |
| Sudanese | 4.1 /100 | #227 | Tragic 53.6% |
| Alaska Natives | 3.9 /100 | #228 | Tragic 53.6% |
| Immigrants | Turkey | 3.8 /100 | #229 | Tragic 53.6% |
| Immigrants | Nepal | 3.6 /100 | #230 | Tragic 53.5% |
| Panamanians | 3.4 /100 | #231 | Tragic 53.5% |
| Immigrants | Guatemala | 3.2 /100 | #232 | Tragic 53.5% |
| Ugandans | 3.2 /100 | #233 | Tragic 53.5% |
| Immigrants | Switzerland | 3.0 /100 | #234 | Tragic 53.4% |
| Immigrants | Middle Africa | 3.0 /100 | #235 | Tragic 53.4% |
| Indonesians | 2.7 /100 | #236 | Tragic 53.4% |
| Macedonians | 2.4 /100 | #237 | Tragic 53.3% |
| Immigrants | Armenia | 2.3 /100 | #238 | Tragic 53.3% |
| Cambodians | 2.3 /100 | #239 | Tragic 53.3% |
| Immigrants | Europe | 2.1 /100 | #240 | Tragic 53.2% |