Chippewa vs Icelander 2 or more Vehicles in Household
COMPARE
Chippewa
Icelander
2 or more Vehicles in Household
2 or more Vehicles in Household Comparison
Chippewa
Icelanders
57.2%
2 OR MORE VEHICLES IN HOUSEHOLD
96.6/ 100
METRIC RATING
115th/ 347
METRIC RANK
58.0%
2 OR MORE VEHICLES IN HOUSEHOLD
99.2/ 100
METRIC RATING
83rd/ 347
METRIC RANK
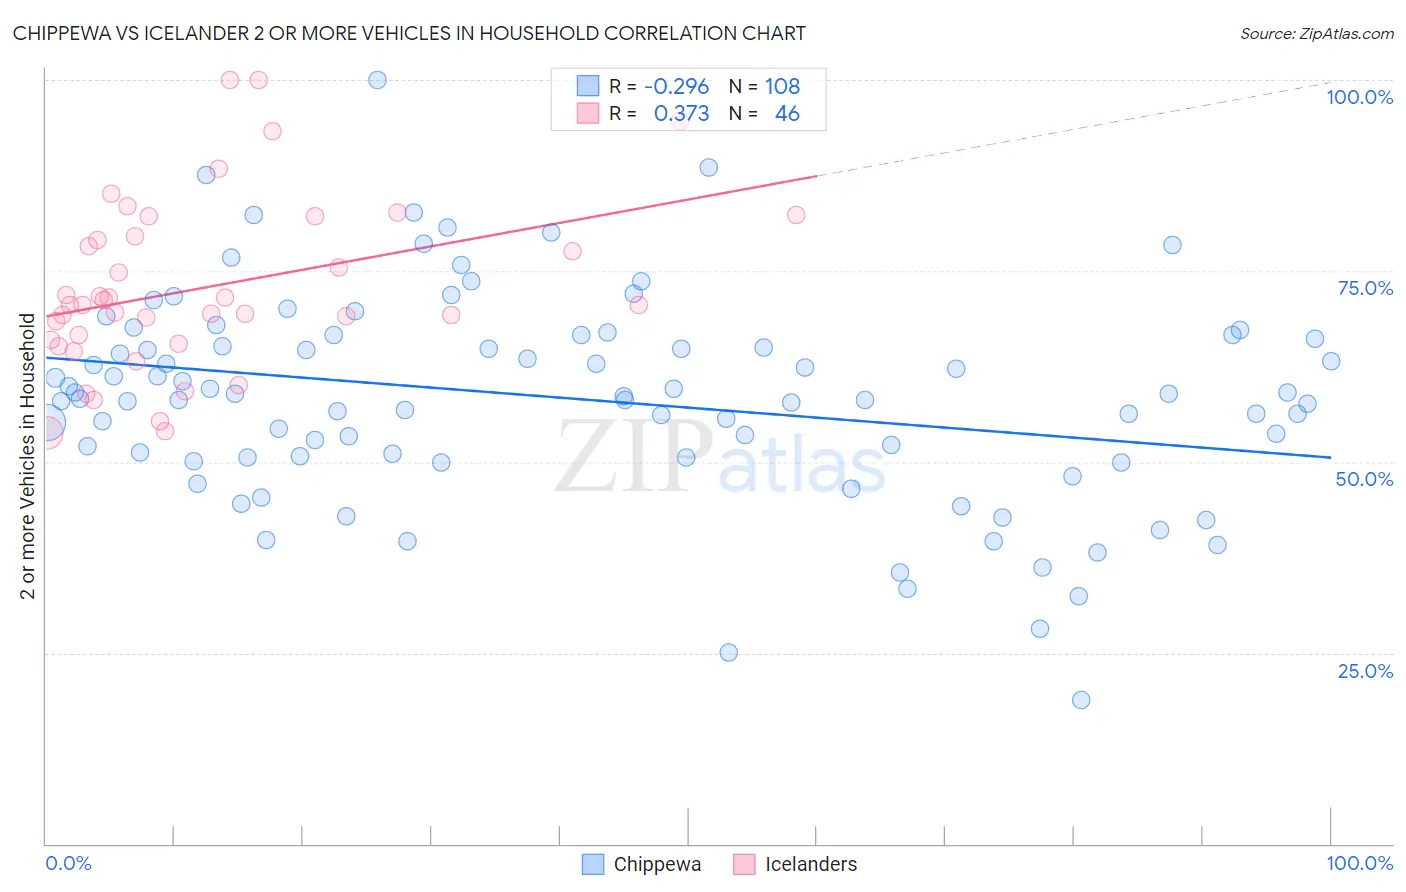
Chippewa vs Icelander 2 or more Vehicles in Household Correlation Chart
The statistical analysis conducted on geographies consisting of 215,015,237 people shows a weak negative correlation between the proportion of Chippewa and percentage of households with 2 or more vehicles available in the United States with a correlation coefficient (R) of -0.296 and weighted average of 57.2%. Similarly, the statistical analysis conducted on geographies consisting of 159,625,716 people shows a mild positive correlation between the proportion of Icelanders and percentage of households with 2 or more vehicles available in the United States with a correlation coefficient (R) of 0.373 and weighted average of 58.0%, a difference of 1.5%.
2 or more Vehicles in Household Correlation Summary
| Measurement | Chippewa | Icelander |
| Minimum | 18.9% | 53.8% |
| Maximum | 100.0% | 100.0% |
| Range | 81.1% | 46.2% |
| Mean | 58.3% | 72.9% |
| Median | 58.5% | 70.6% |
| Interquartile 25% (IQ1) | 50.7% | 66.0% |
| Interquartile 75% (IQ3) | 66.4% | 79.6% |
| Interquartile Range (IQR) | 15.7% | 13.6% |
| Standard Deviation (Sample) | 13.7% | 11.2% |
| Standard Deviation (Population) | 13.7% | 11.1% |
Similar Demographics by 2 or more Vehicles in Household
Demographics Similar to Chippewa by 2 or more Vehicles in Household
In terms of 2 or more vehicles in household, the demographic groups most similar to Chippewa are Immigrants from Jordan (57.2%, a difference of 0.010%), Immigrants from Lebanon (57.2%, a difference of 0.050%), Zimbabwean (57.2%, a difference of 0.090%), Iraqi (57.1%, a difference of 0.20%), and Asian (57.0%, a difference of 0.37%).
| Demographics | Rating | Rank | 2 or more Vehicles in Household |
| Immigrants | Canada | 98.1 /100 | #108 | Exceptional 57.5% |
| Immigrants | North America | 98.1 /100 | #109 | Exceptional 57.5% |
| Japanese | 98.0 /100 | #110 | Exceptional 57.5% |
| Greeks | 98.0 /100 | #111 | Exceptional 57.5% |
| Pueblo | 98.0 /100 | #112 | Exceptional 57.5% |
| Zimbabweans | 96.9 /100 | #113 | Exceptional 57.2% |
| Immigrants | Lebanon | 96.8 /100 | #114 | Exceptional 57.2% |
| Chippewa | 96.6 /100 | #115 | Exceptional 57.2% |
| Immigrants | Jordan | 96.6 /100 | #116 | Exceptional 57.2% |
| Iraqis | 95.8 /100 | #117 | Exceptional 57.1% |
| Asians | 95.1 /100 | #118 | Exceptional 57.0% |
| Natives/Alaskans | 95.0 /100 | #119 | Exceptional 57.0% |
| Costa Ricans | 94.7 /100 | #120 | Exceptional 56.9% |
| Sioux | 93.8 /100 | #121 | Exceptional 56.8% |
| Immigrants | South Africa | 92.5 /100 | #122 | Exceptional 56.7% |
Demographics Similar to Icelanders by 2 or more Vehicles in Household
In terms of 2 or more vehicles in household, the demographic groups most similar to Icelanders are Maltese (58.0%, a difference of 0.030%), Iranian (58.1%, a difference of 0.040%), Slovak (58.0%, a difference of 0.080%), Potawatomi (58.0%, a difference of 0.11%), and Immigrants from Iraq (58.1%, a difference of 0.12%).
| Demographics | Rating | Rank | 2 or more Vehicles in Household |
| Creek | 99.5 /100 | #76 | Exceptional 58.3% |
| Slovenes | 99.5 /100 | #77 | Exceptional 58.3% |
| Lithuanians | 99.5 /100 | #78 | Exceptional 58.2% |
| Delaware | 99.4 /100 | #79 | Exceptional 58.2% |
| Immigrants | England | 99.3 /100 | #80 | Exceptional 58.1% |
| Immigrants | Iraq | 99.3 /100 | #81 | Exceptional 58.1% |
| Iranians | 99.3 /100 | #82 | Exceptional 58.1% |
| Icelanders | 99.2 /100 | #83 | Exceptional 58.0% |
| Maltese | 99.2 /100 | #84 | Exceptional 58.0% |
| Slovaks | 99.2 /100 | #85 | Exceptional 58.0% |
| Potawatomi | 99.1 /100 | #86 | Exceptional 58.0% |
| Thais | 99.1 /100 | #87 | Exceptional 57.9% |
| Immigrants | Iran | 99.1 /100 | #88 | Exceptional 57.9% |
| Immigrants | Germany | 99.0 /100 | #89 | Exceptional 57.9% |
| Hispanics or Latinos | 99.0 /100 | #90 | Exceptional 57.9% |