Finnish vs Ugandan 2 or more Vehicles in Household
COMPARE
Finnish
Ugandan
2 or more Vehicles in Household
2 or more Vehicles in Household Comparison
Finns
Ugandans
60.3%
2 OR MORE VEHICLES IN HOUSEHOLD
100.0/ 100
METRIC RATING
30th/ 347
METRIC RANK
53.5%
2 OR MORE VEHICLES IN HOUSEHOLD
3.2/ 100
METRIC RATING
233rd/ 347
METRIC RANK
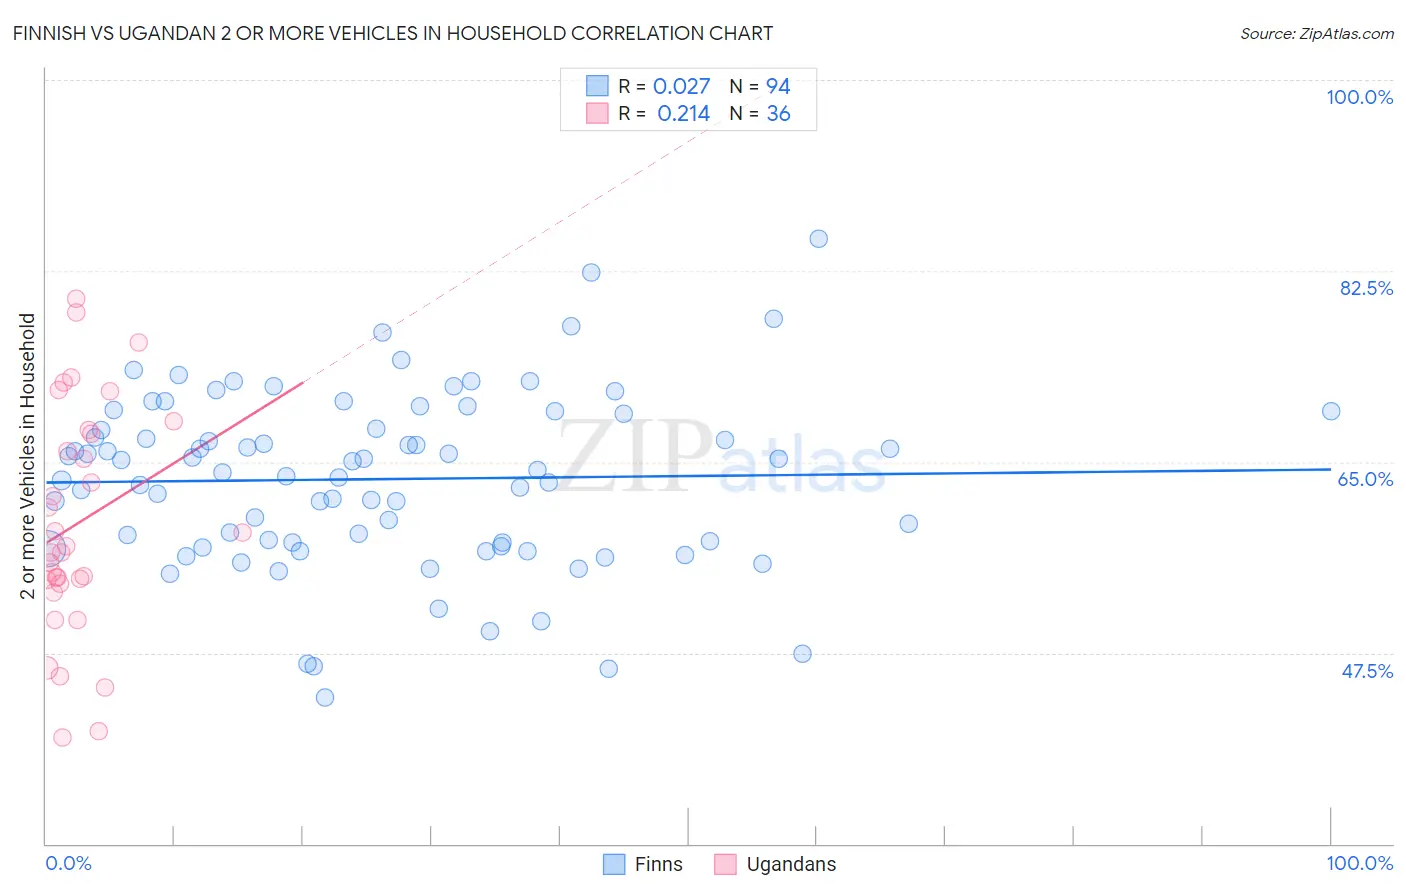
Finnish vs Ugandan 2 or more Vehicles in Household Correlation Chart
The statistical analysis conducted on geographies consisting of 404,547,862 people shows no correlation between the proportion of Finns and percentage of households with 2 or more vehicles available in the United States with a correlation coefficient (R) of 0.027 and weighted average of 60.3%. Similarly, the statistical analysis conducted on geographies consisting of 93,998,632 people shows a weak positive correlation between the proportion of Ugandans and percentage of households with 2 or more vehicles available in the United States with a correlation coefficient (R) of 0.214 and weighted average of 53.5%, a difference of 12.8%.
2 or more Vehicles in Household Correlation Summary
| Measurement | Finnish | Ugandan |
| Minimum | 43.4% | 39.7% |
| Maximum | 85.5% | 80.0% |
| Range | 42.1% | 40.3% |
| Mean | 63.4% | 59.4% |
| Median | 64.1% | 57.0% |
| Interquartile 25% (IQ1) | 57.6% | 54.0% |
| Interquartile 75% (IQ3) | 69.4% | 67.8% |
| Interquartile Range (IQR) | 11.8% | 13.8% |
| Standard Deviation (Sample) | 8.0% | 10.4% |
| Standard Deviation (Population) | 8.0% | 10.3% |
Similar Demographics by 2 or more Vehicles in Household
Demographics Similar to Finns by 2 or more Vehicles in Household
In terms of 2 or more vehicles in household, the demographic groups most similar to Finns are Spanish American Indian (60.3%, a difference of 0.030%), Hawaiian (60.4%, a difference of 0.13%), Arapaho (60.2%, a difference of 0.13%), Immigrants from Mexico (60.2%, a difference of 0.19%), and Guamanian/Chamorro (60.5%, a difference of 0.24%).
| Demographics | Rating | Rank | 2 or more Vehicles in Household |
| Scotch-Irish | 100.0 /100 | #23 | Exceptional 60.9% |
| Immigrants | Vietnam | 100.0 /100 | #24 | Exceptional 60.9% |
| Whites/Caucasians | 100.0 /100 | #25 | Exceptional 60.8% |
| Welsh | 100.0 /100 | #26 | Exceptional 60.8% |
| Assyrians/Chaldeans/Syriacs | 100.0 /100 | #27 | Exceptional 60.5% |
| Guamanians/Chamorros | 100.0 /100 | #28 | Exceptional 60.5% |
| Hawaiians | 100.0 /100 | #29 | Exceptional 60.4% |
| Finns | 100.0 /100 | #30 | Exceptional 60.3% |
| Spanish American Indians | 100.0 /100 | #31 | Exceptional 60.3% |
| Arapaho | 100.0 /100 | #32 | Exceptional 60.2% |
| Immigrants | Mexico | 100.0 /100 | #33 | Exceptional 60.2% |
| Spanish | 100.0 /100 | #34 | Exceptional 60.2% |
| Immigrants | Philippines | 100.0 /100 | #35 | Exceptional 60.1% |
| Chinese | 100.0 /100 | #36 | Exceptional 60.1% |
| Irish | 100.0 /100 | #37 | Exceptional 60.1% |
Demographics Similar to Ugandans by 2 or more Vehicles in Household
In terms of 2 or more vehicles in household, the demographic groups most similar to Ugandans are Immigrants from Guatemala (53.5%, a difference of 0.010%), Immigrants from Switzerland (53.4%, a difference of 0.060%), Panamanian (53.5%, a difference of 0.080%), Immigrants from Middle Africa (53.4%, a difference of 0.090%), and Immigrants from Nepal (53.5%, a difference of 0.13%).
| Demographics | Rating | Rank | 2 or more Vehicles in Household |
| Immigrants | Eastern Africa | 5.1 /100 | #226 | Tragic 53.7% |
| Sudanese | 4.1 /100 | #227 | Tragic 53.6% |
| Alaska Natives | 3.9 /100 | #228 | Tragic 53.6% |
| Immigrants | Turkey | 3.8 /100 | #229 | Tragic 53.6% |
| Immigrants | Nepal | 3.6 /100 | #230 | Tragic 53.5% |
| Panamanians | 3.4 /100 | #231 | Tragic 53.5% |
| Immigrants | Guatemala | 3.2 /100 | #232 | Tragic 53.5% |
| Ugandans | 3.2 /100 | #233 | Tragic 53.5% |
| Immigrants | Switzerland | 3.0 /100 | #234 | Tragic 53.4% |
| Immigrants | Middle Africa | 3.0 /100 | #235 | Tragic 53.4% |
| Indonesians | 2.7 /100 | #236 | Tragic 53.4% |
| Macedonians | 2.4 /100 | #237 | Tragic 53.3% |
| Immigrants | Armenia | 2.3 /100 | #238 | Tragic 53.3% |
| Cambodians | 2.3 /100 | #239 | Tragic 53.3% |
| Immigrants | Europe | 2.1 /100 | #240 | Tragic 53.2% |