Chippewa vs Ugandan Median Female Earnings
COMPARE
Chippewa
Ugandan
Median Female Earnings
Median Female Earnings Comparison
Chippewa
Ugandans
$35,003
MEDIAN FEMALE EARNINGS
0.0/ 100
METRIC RATING
310th/ 347
METRIC RANK
$40,889
MEDIAN FEMALE EARNINGS
92.2/ 100
METRIC RATING
127th/ 347
METRIC RANK
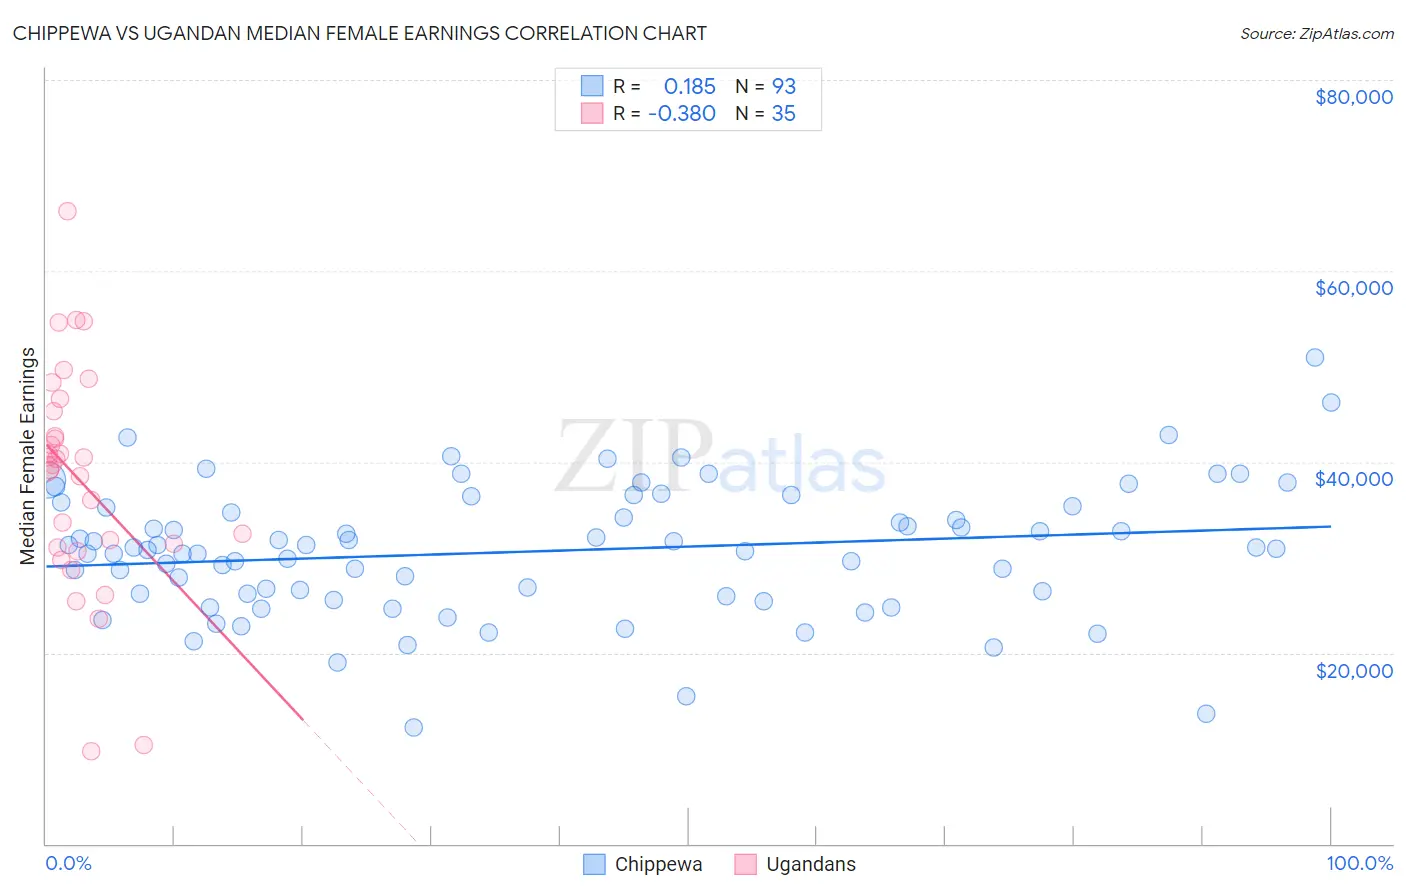
Chippewa vs Ugandan Median Female Earnings Correlation Chart
The statistical analysis conducted on geographies consisting of 214,968,178 people shows a poor positive correlation between the proportion of Chippewa and median female earnings in the United States with a correlation coefficient (R) of 0.185 and weighted average of $35,003. Similarly, the statistical analysis conducted on geographies consisting of 94,007,517 people shows a mild negative correlation between the proportion of Ugandans and median female earnings in the United States with a correlation coefficient (R) of -0.380 and weighted average of $40,889, a difference of 16.8%.
Median Female Earnings Correlation Summary
| Measurement | Chippewa | Ugandan |
| Minimum | $12,188 | $9,732 |
| Maximum | $50,958 | $66,250 |
| Range | $38,770 | $56,518 |
| Mean | $30,628 | $38,170 |
| Median | $30,893 | $39,623 |
| Interquartile 25% (IQ1) | $26,067 | $31,024 |
| Interquartile 75% (IQ3) | $35,324 | $45,270 |
| Interquartile Range (IQR) | $9,258 | $14,246 |
| Standard Deviation (Sample) | $6,851 | $11,739 |
| Standard Deviation (Population) | $6,814 | $11,570 |
Similar Demographics by Median Female Earnings
Demographics Similar to Chippewa by Median Female Earnings
In terms of median female earnings, the demographic groups most similar to Chippewa are Honduran ($35,013, a difference of 0.030%), Immigrants from Bahamas ($35,027, a difference of 0.070%), Ute ($34,960, a difference of 0.12%), Sioux ($35,063, a difference of 0.17%), and Yaqui ($34,943, a difference of 0.17%).
| Demographics | Rating | Rank | Median Female Earnings |
| Immigrants | Latin America | 0.0 /100 | #303 | Tragic $35,307 |
| Crow | 0.0 /100 | #304 | Tragic $35,266 |
| Bahamians | 0.0 /100 | #305 | Tragic $35,125 |
| Fijians | 0.0 /100 | #306 | Tragic $35,114 |
| Sioux | 0.0 /100 | #307 | Tragic $35,063 |
| Immigrants | Bahamas | 0.0 /100 | #308 | Tragic $35,027 |
| Hondurans | 0.0 /100 | #309 | Tragic $35,013 |
| Chippewa | 0.0 /100 | #310 | Tragic $35,003 |
| Ute | 0.0 /100 | #311 | Tragic $34,960 |
| Yaqui | 0.0 /100 | #312 | Tragic $34,943 |
| Cubans | 0.0 /100 | #313 | Tragic $34,942 |
| Apache | 0.0 /100 | #314 | Tragic $34,895 |
| Pennsylvania Germans | 0.0 /100 | #315 | Tragic $34,802 |
| Cherokee | 0.0 /100 | #316 | Tragic $34,742 |
| Potawatomi | 0.0 /100 | #317 | Tragic $34,739 |
Demographics Similar to Ugandans by Median Female Earnings
In terms of median female earnings, the demographic groups most similar to Ugandans are Immigrants from Trinidad and Tobago ($40,895, a difference of 0.020%), Austrian ($40,923, a difference of 0.080%), Carpatho Rusyn ($40,825, a difference of 0.16%), Trinidadian and Tobagonian ($40,958, a difference of 0.17%), and Guyanese ($40,973, a difference of 0.21%).
| Demographics | Rating | Rank | Median Female Earnings |
| Immigrants | Kuwait | 94.4 /100 | #120 | Exceptional $41,055 |
| Croatians | 93.7 /100 | #121 | Exceptional $40,993 |
| Immigrants | Jordan | 93.5 /100 | #122 | Exceptional $40,977 |
| Guyanese | 93.4 /100 | #123 | Exceptional $40,973 |
| Trinidadians and Tobagonians | 93.2 /100 | #124 | Exceptional $40,958 |
| Austrians | 92.7 /100 | #125 | Exceptional $40,923 |
| Immigrants | Trinidad and Tobago | 92.3 /100 | #126 | Exceptional $40,895 |
| Ugandans | 92.2 /100 | #127 | Exceptional $40,889 |
| Carpatho Rusyns | 91.2 /100 | #128 | Exceptional $40,825 |
| Zimbabweans | 90.8 /100 | #129 | Exceptional $40,798 |
| Immigrants | Guyana | 90.3 /100 | #130 | Exceptional $40,773 |
| Chileans | 90.0 /100 | #131 | Exceptional $40,757 |
| Immigrants | Uganda | 89.7 /100 | #132 | Excellent $40,739 |
| Syrians | 89.5 /100 | #133 | Excellent $40,727 |
| Arabs | 89.3 /100 | #134 | Excellent $40,718 |