Central American Indian vs Dominican 3 or more Vehicles in Household
COMPARE
Central American Indian
Dominican
3 or more Vehicles in Household
3 or more Vehicles in Household Comparison
Central American Indians
Dominicans
19.0%
3 OR MORE VEHICLES IN HOUSEHOLD
22.2/ 100
METRIC RATING
196th/ 347
METRIC RANK
11.2%
3 OR MORE VEHICLES IN HOUSEHOLD
0.0/ 100
METRIC RATING
344th/ 347
METRIC RANK
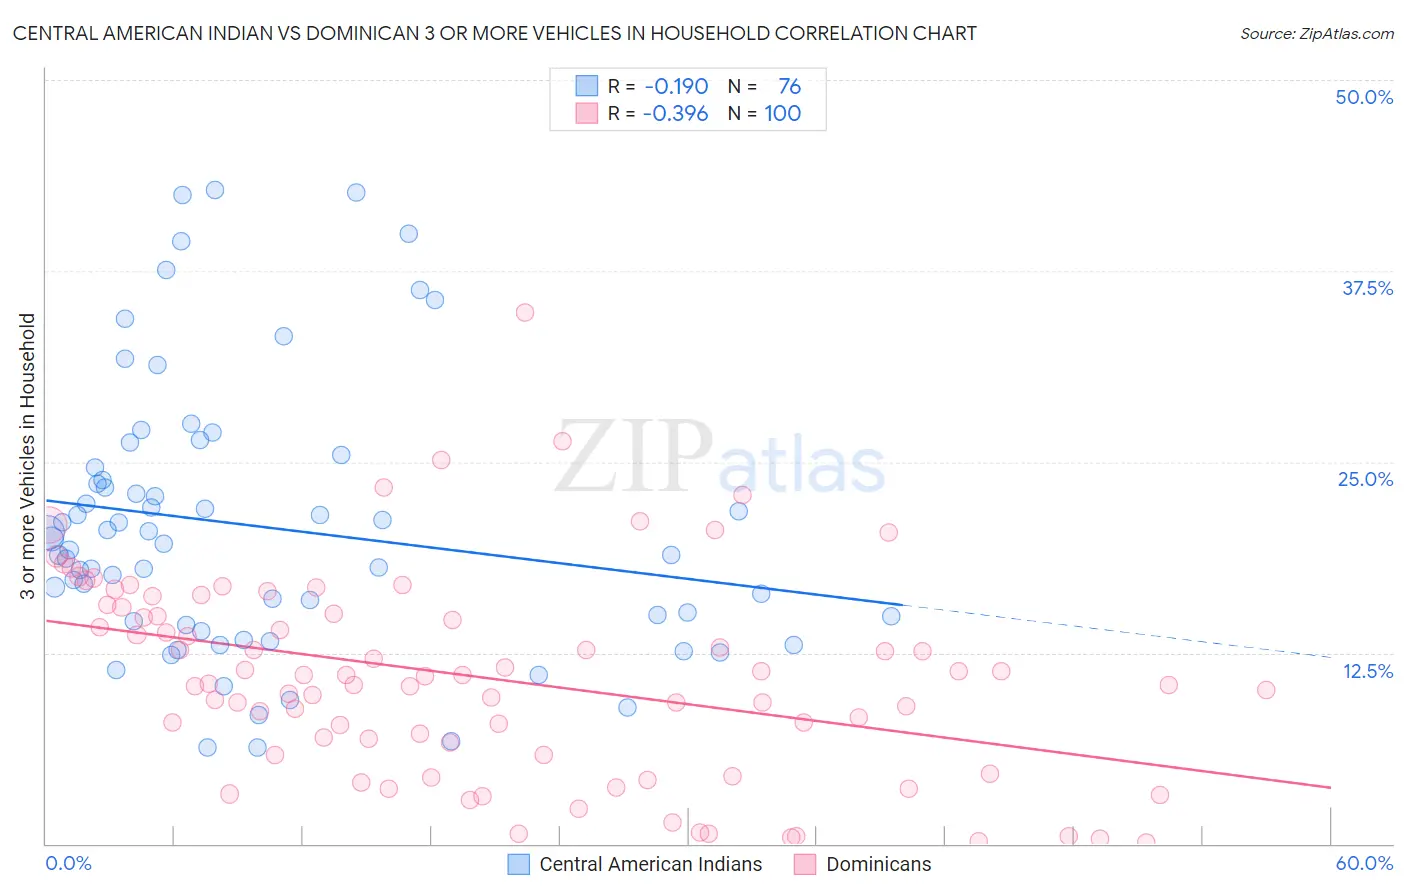
Central American Indian vs Dominican 3 or more Vehicles in Household Correlation Chart
The statistical analysis conducted on geographies consisting of 326,022,544 people shows a poor negative correlation between the proportion of Central American Indians and percentage of households with 3 or more vehicles available in the United States with a correlation coefficient (R) of -0.190 and weighted average of 19.0%. Similarly, the statistical analysis conducted on geographies consisting of 354,643,903 people shows a mild negative correlation between the proportion of Dominicans and percentage of households with 3 or more vehicles available in the United States with a correlation coefficient (R) of -0.396 and weighted average of 11.2%, a difference of 69.6%.
3 or more Vehicles in Household Correlation Summary
| Measurement | Central American Indian | Dominican |
| Minimum | 6.3% | 0.12% |
| Maximum | 42.8% | 34.8% |
| Range | 36.6% | 34.6% |
| Mean | 20.8% | 10.9% |
| Median | 19.4% | 10.7% |
| Interquartile 25% (IQ1) | 14.4% | 6.2% |
| Interquartile 75% (IQ3) | 24.2% | 15.3% |
| Interquartile Range (IQR) | 9.8% | 9.1% |
| Standard Deviation (Sample) | 8.9% | 6.7% |
| Standard Deviation (Population) | 8.8% | 6.6% |
Similar Demographics by 3 or more Vehicles in Household
Demographics Similar to Central American Indians by 3 or more Vehicles in Household
In terms of 3 or more vehicles in household, the demographic groups most similar to Central American Indians are Immigrants from Japan (19.0%, a difference of 0.030%), Immigrants from Moldova (19.1%, a difference of 0.15%), Serbian (19.1%, a difference of 0.19%), Tsimshian (19.1%, a difference of 0.23%), and Kenyan (19.1%, a difference of 0.27%).
| Demographics | Rating | Rank | 3 or more Vehicles in Household |
| Indians (Asian) | 26.0 /100 | #189 | Fair 19.1% |
| Immigrants | Zimbabwe | 25.5 /100 | #190 | Fair 19.1% |
| South American Indians | 25.4 /100 | #191 | Fair 19.1% |
| Kenyans | 24.7 /100 | #192 | Fair 19.1% |
| Tsimshian | 24.4 /100 | #193 | Fair 19.1% |
| Serbians | 24.0 /100 | #194 | Fair 19.1% |
| Immigrants | Moldova | 23.6 /100 | #195 | Fair 19.1% |
| Central American Indians | 22.2 /100 | #196 | Fair 19.0% |
| Immigrants | Japan | 22.0 /100 | #197 | Fair 19.0% |
| Egyptians | 19.5 /100 | #198 | Poor 19.0% |
| Immigrants | Norway | 19.0 /100 | #199 | Poor 19.0% |
| Argentineans | 18.2 /100 | #200 | Poor 18.9% |
| Arabs | 17.7 /100 | #201 | Poor 18.9% |
| Immigrants | Austria | 15.4 /100 | #202 | Poor 18.9% |
| Tohono O'odham | 14.8 /100 | #203 | Poor 18.9% |
Demographics Similar to Dominicans by 3 or more Vehicles in Household
In terms of 3 or more vehicles in household, the demographic groups most similar to Dominicans are Immigrants from Guyana (11.2%, a difference of 0.15%), British West Indian (11.4%, a difference of 2.0%), Guyanese (11.5%, a difference of 2.0%), Immigrants from Barbados (11.7%, a difference of 4.4%), and Immigrants from Uzbekistan (12.0%, a difference of 6.8%).
| Demographics | Rating | Rank | 3 or more Vehicles in Household |
| Immigrants | Cabo Verde | 0.0 /100 | #333 | Tragic 13.6% |
| Immigrants | Ecuador | 0.0 /100 | #334 | Tragic 13.4% |
| Immigrants | Trinidad and Tobago | 0.0 /100 | #335 | Tragic 13.3% |
| Barbadians | 0.0 /100 | #336 | Tragic 12.6% |
| Immigrants | Bangladesh | 0.0 /100 | #337 | Tragic 12.5% |
| Vietnamese | 0.0 /100 | #338 | Tragic 12.5% |
| Immigrants | Uzbekistan | 0.0 /100 | #339 | Tragic 12.0% |
| Immigrants | Barbados | 0.0 /100 | #340 | Tragic 11.7% |
| Guyanese | 0.0 /100 | #341 | Tragic 11.5% |
| British West Indians | 0.0 /100 | #342 | Tragic 11.4% |
| Immigrants | Guyana | 0.0 /100 | #343 | Tragic 11.2% |
| Dominicans | 0.0 /100 | #344 | Tragic 11.2% |
| Immigrants | Dominican Republic | 0.0 /100 | #345 | Tragic 10.4% |
| Immigrants | St. Vincent and the Grenadines | 0.0 /100 | #346 | Tragic 10.1% |
| Immigrants | Grenada | 0.0 /100 | #347 | Tragic 9.1% |