Central American Indian vs Dominican Currently Married
COMPARE
Central American Indian
Dominican
Currently Married
Currently Married Comparison
Central American Indians
Dominicans
43.3%
CURRENTLY MARRIED
0.0/ 100
METRIC RATING
279th/ 347
METRIC RANK
39.5%
CURRENTLY MARRIED
0.0/ 100
METRIC RATING
339th/ 347
METRIC RANK
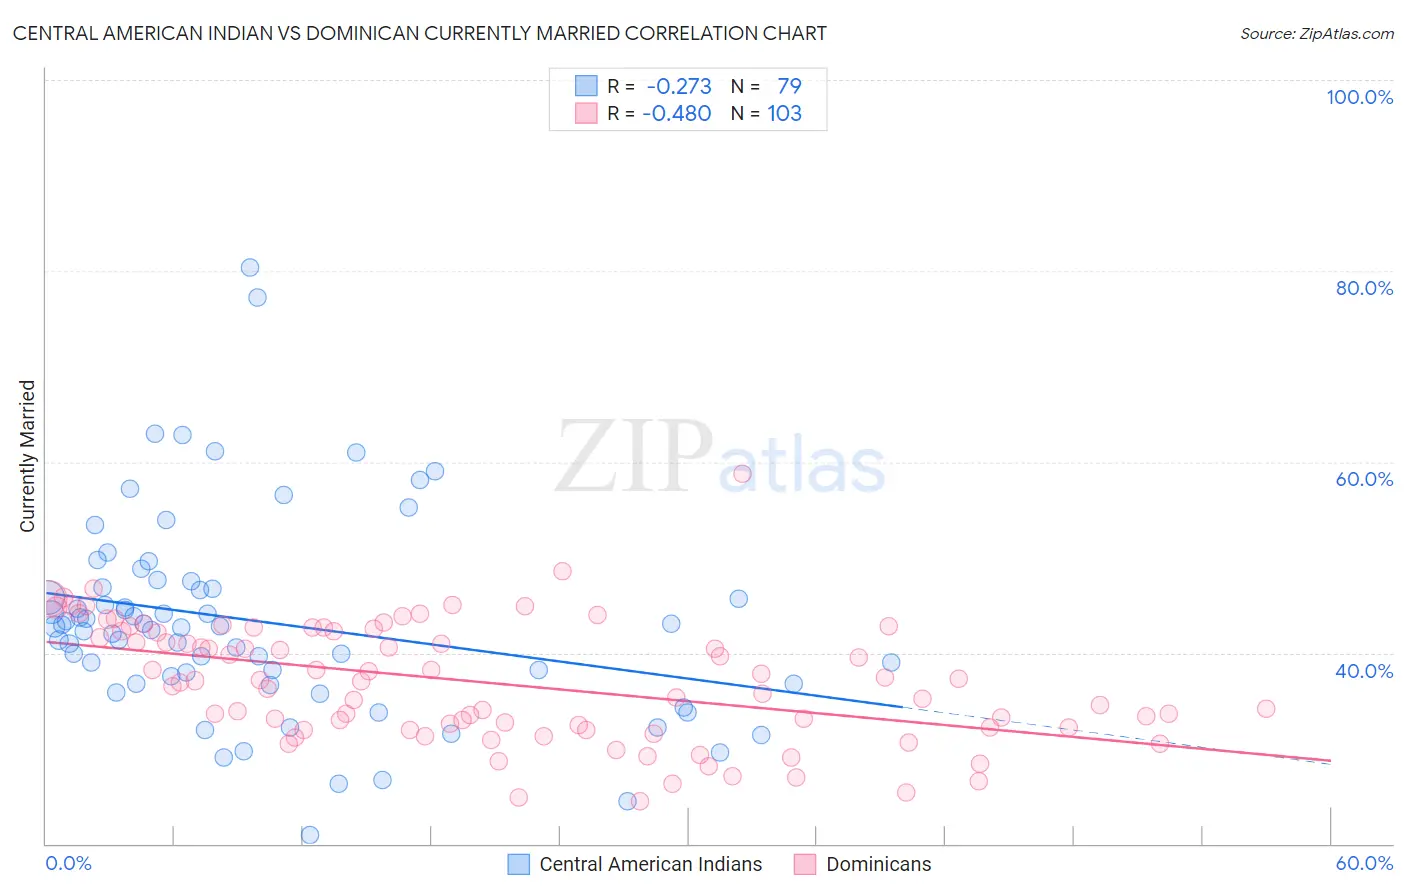
Central American Indian vs Dominican Currently Married Correlation Chart
The statistical analysis conducted on geographies consisting of 326,134,160 people shows a weak negative correlation between the proportion of Central American Indians and percentage of population currently married in the United States with a correlation coefficient (R) of -0.273 and weighted average of 43.3%. Similarly, the statistical analysis conducted on geographies consisting of 355,078,950 people shows a moderate negative correlation between the proportion of Dominicans and percentage of population currently married in the United States with a correlation coefficient (R) of -0.480 and weighted average of 39.5%, a difference of 9.5%.
Currently Married Correlation Summary
| Measurement | Central American Indian | Dominican |
| Minimum | 20.9% | 24.4% |
| Maximum | 80.4% | 58.8% |
| Range | 59.5% | 34.4% |
| Mean | 43.3% | 36.9% |
| Median | 42.8% | 37.0% |
| Interquartile 25% (IQ1) | 36.8% | 32.2% |
| Interquartile 75% (IQ3) | 46.8% | 42.3% |
| Interquartile Range (IQR) | 10.0% | 10.1% |
| Standard Deviation (Sample) | 10.6% | 6.3% |
| Standard Deviation (Population) | 10.5% | 6.2% |
Similar Demographics by Currently Married
Demographics Similar to Central American Indians by Currently Married
In terms of currently married, the demographic groups most similar to Central American Indians are Apache (43.2%, a difference of 0.080%), Chippewa (43.2%, a difference of 0.080%), Central American (43.3%, a difference of 0.15%), Immigrants from Ecuador (43.2%, a difference of 0.16%), and Kiowa (43.2%, a difference of 0.27%).
| Demographics | Rating | Rank | Currently Married |
| Indonesians | 0.1 /100 | #272 | Tragic 43.5% |
| Yaqui | 0.1 /100 | #273 | Tragic 43.4% |
| Nigerians | 0.1 /100 | #274 | Tragic 43.4% |
| Colville | 0.1 /100 | #275 | Tragic 43.4% |
| Sierra Leoneans | 0.1 /100 | #276 | Tragic 43.4% |
| Immigrants | Nigeria | 0.1 /100 | #277 | Tragic 43.4% |
| Central Americans | 0.0 /100 | #278 | Tragic 43.3% |
| Central American Indians | 0.0 /100 | #279 | Tragic 43.3% |
| Apache | 0.0 /100 | #280 | Tragic 43.2% |
| Chippewa | 0.0 /100 | #281 | Tragic 43.2% |
| Immigrants | Ecuador | 0.0 /100 | #282 | Tragic 43.2% |
| Kiowa | 0.0 /100 | #283 | Tragic 43.2% |
| Immigrants | El Salvador | 0.0 /100 | #284 | Tragic 43.1% |
| Immigrants | Middle Africa | 0.0 /100 | #285 | Tragic 43.0% |
| Ghanaians | 0.0 /100 | #286 | Tragic 42.9% |
Demographics Similar to Dominicans by Currently Married
In terms of currently married, the demographic groups most similar to Dominicans are Cape Verdean (39.6%, a difference of 0.15%), Black/African American (39.6%, a difference of 0.25%), British West Indian (39.8%, a difference of 0.63%), Lumbee (39.8%, a difference of 0.80%), and Immigrants from Grenada (39.1%, a difference of 0.96%).
| Demographics | Rating | Rank | Currently Married |
| Immigrants | St. Vincent and the Grenadines | 0.0 /100 | #332 | Tragic 40.1% |
| Yup'ik | 0.0 /100 | #333 | Tragic 39.9% |
| Puerto Ricans | 0.0 /100 | #334 | Tragic 39.9% |
| Lumbee | 0.0 /100 | #335 | Tragic 39.8% |
| British West Indians | 0.0 /100 | #336 | Tragic 39.8% |
| Blacks/African Americans | 0.0 /100 | #337 | Tragic 39.6% |
| Cape Verdeans | 0.0 /100 | #338 | Tragic 39.6% |
| Dominicans | 0.0 /100 | #339 | Tragic 39.5% |
| Immigrants | Grenada | 0.0 /100 | #340 | Tragic 39.1% |
| Navajo | 0.0 /100 | #341 | Tragic 39.0% |
| Immigrants | Dominican Republic | 0.0 /100 | #342 | Tragic 38.9% |
| Pueblo | 0.0 /100 | #343 | Tragic 38.2% |
| Immigrants | Cabo Verde | 0.0 /100 | #344 | Tragic 37.8% |
| Tohono O'odham | 0.0 /100 | #345 | Tragic 36.8% |
| Hopi | 0.0 /100 | #346 | Tragic 36.5% |