Central American Indian vs Dominican High School Diploma
COMPARE
Central American Indian
Dominican
High School Diploma
High School Diploma Comparison
Central American Indians
Dominicans
84.2%
HIGH SCHOOL DIPLOMA
0.0/ 100
METRIC RATING
319th/ 347
METRIC RANK
82.9%
HIGH SCHOOL DIPLOMA
0.0/ 100
METRIC RATING
328th/ 347
METRIC RANK
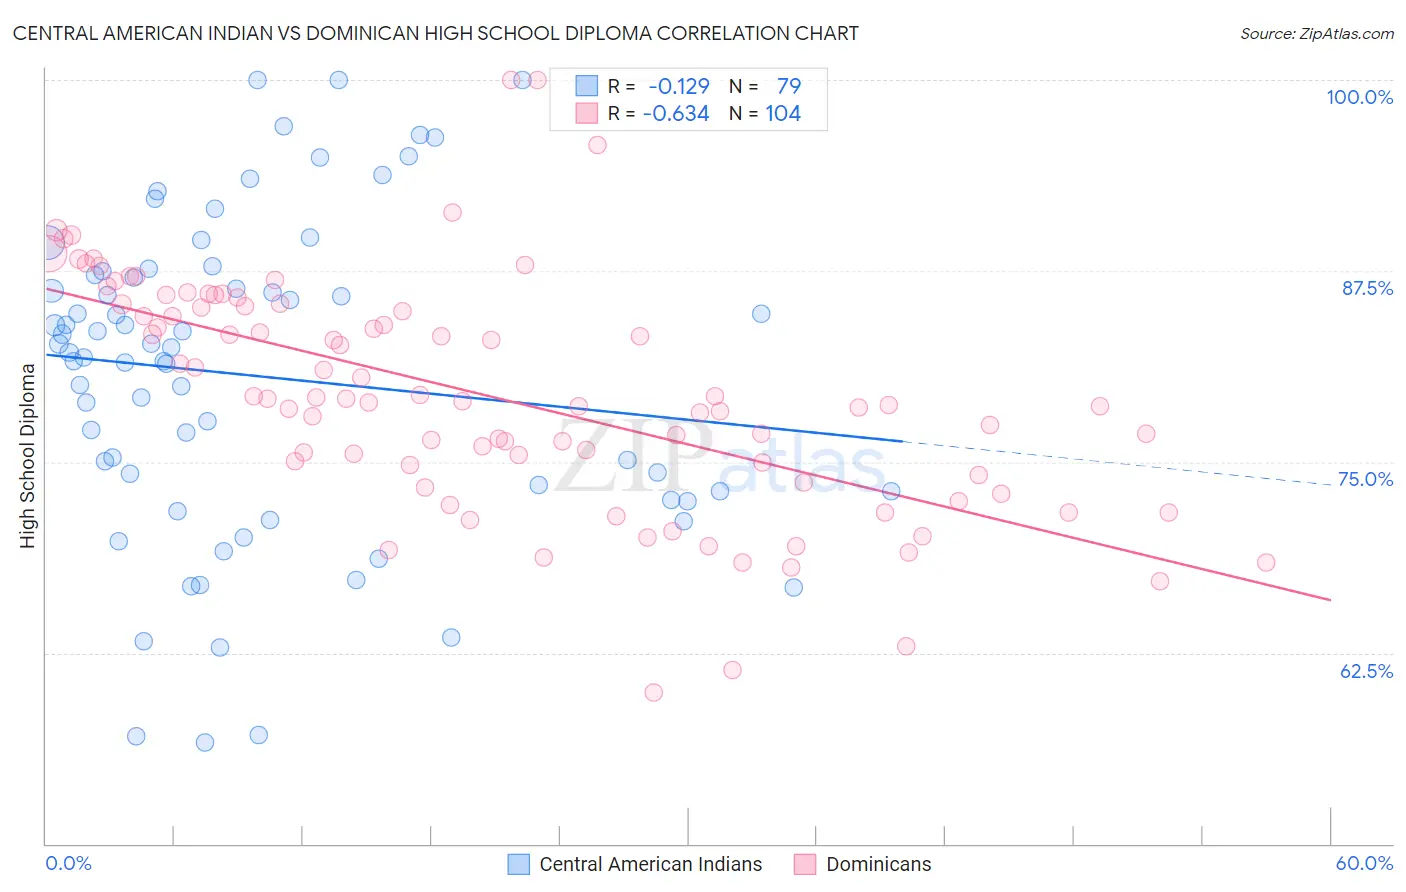
Central American Indian vs Dominican High School Diploma Correlation Chart
The statistical analysis conducted on geographies consisting of 326,142,643 people shows a poor negative correlation between the proportion of Central American Indians and percentage of population with at least high school diploma education in the United States with a correlation coefficient (R) of -0.129 and weighted average of 84.2%. Similarly, the statistical analysis conducted on geographies consisting of 355,143,036 people shows a significant negative correlation between the proportion of Dominicans and percentage of population with at least high school diploma education in the United States with a correlation coefficient (R) of -0.634 and weighted average of 82.9%, a difference of 1.5%.
High School Diploma Correlation Summary
| Measurement | Central American Indian | Dominican |
| Minimum | 56.6% | 59.9% |
| Maximum | 100.0% | 100.0% |
| Range | 43.4% | 40.1% |
| Mean | 80.6% | 79.4% |
| Median | 82.2% | 79.0% |
| Interquartile 25% (IQ1) | 73.1% | 74.5% |
| Interquartile 75% (IQ3) | 87.3% | 85.3% |
| Interquartile Range (IQR) | 14.2% | 10.8% |
| Standard Deviation (Sample) | 10.4% | 7.6% |
| Standard Deviation (Population) | 10.3% | 7.6% |
Demographics Similar to Central American Indians and Dominicans by High School Diploma
In terms of high school diploma, the demographic groups most similar to Central American Indians are Immigrants from Belize (84.2%, a difference of 0.040%), Nicaraguan (84.1%, a difference of 0.10%), Immigrants from Caribbean (84.3%, a difference of 0.11%), Belizean (84.3%, a difference of 0.16%), and Yuman (84.0%, a difference of 0.24%). Similarly, the demographic groups most similar to Dominicans are Honduran (83.0%, a difference of 0.050%), Mexican American Indian (83.0%, a difference of 0.090%), Hispanic or Latino (82.9%, a difference of 0.10%), Immigrants from Nicaragua (83.1%, a difference of 0.16%), and Immigrants from the Azores (82.8%, a difference of 0.17%).
| Demographics | Rating | Rank | High School Diploma |
| Immigrants | Ecuador | 0.0 /100 | #313 | Tragic 84.8% |
| Yaqui | 0.0 /100 | #314 | Tragic 84.7% |
| Puerto Ricans | 0.0 /100 | #315 | Tragic 84.7% |
| Belizeans | 0.0 /100 | #316 | Tragic 84.3% |
| Immigrants | Caribbean | 0.0 /100 | #317 | Tragic 84.3% |
| Immigrants | Belize | 0.0 /100 | #318 | Tragic 84.2% |
| Central American Indians | 0.0 /100 | #319 | Tragic 84.2% |
| Nicaraguans | 0.0 /100 | #320 | Tragic 84.1% |
| Yuman | 0.0 /100 | #321 | Tragic 84.0% |
| Lumbee | 0.0 /100 | #322 | Tragic 83.6% |
| Immigrants | Cuba | 0.0 /100 | #323 | Tragic 83.5% |
| Immigrants | Cabo Verde | 0.0 /100 | #324 | Tragic 83.3% |
| Immigrants | Nicaragua | 0.0 /100 | #325 | Tragic 83.1% |
| Mexican American Indians | 0.0 /100 | #326 | Tragic 83.0% |
| Hondurans | 0.0 /100 | #327 | Tragic 83.0% |
| Dominicans | 0.0 /100 | #328 | Tragic 82.9% |
| Hispanics or Latinos | 0.0 /100 | #329 | Tragic 82.9% |
| Immigrants | Azores | 0.0 /100 | #330 | Tragic 82.8% |
| Central Americans | 0.0 /100 | #331 | Tragic 82.5% |
| Immigrants | Honduras | 0.0 /100 | #332 | Tragic 82.5% |
| Immigrants | Latin America | 0.0 /100 | #333 | Tragic 82.1% |