Immigrants from St. Vincent and the Grenadines vs Dominican 3 or more Vehicles in Household
COMPARE
Immigrants from St. Vincent and the Grenadines
Dominican
3 or more Vehicles in Household
3 or more Vehicles in Household Comparison
Immigrants from St. Vincent and the Grenadines
Dominicans
10.1%
3 OR MORE VEHICLES IN HOUSEHOLD
0.0/ 100
METRIC RATING
346th/ 347
METRIC RANK
11.2%
3 OR MORE VEHICLES IN HOUSEHOLD
0.0/ 100
METRIC RATING
344th/ 347
METRIC RANK
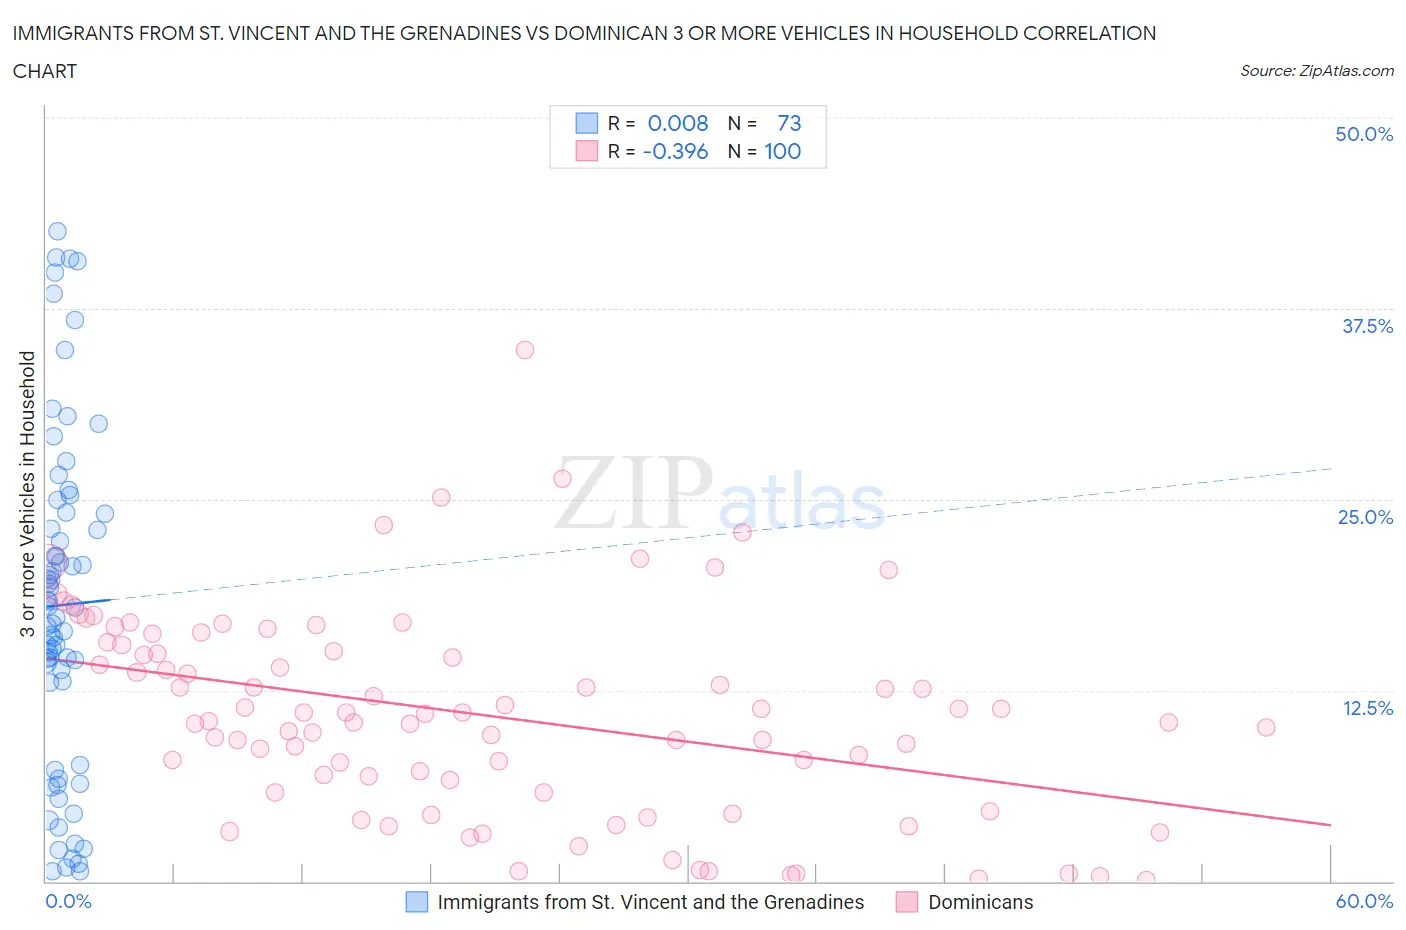
Immigrants from St. Vincent and the Grenadines vs Dominican 3 or more Vehicles in Household Correlation Chart
The statistical analysis conducted on geographies consisting of 56,188,620 people shows no correlation between the proportion of Immigrants from St. Vincent and the Grenadines and percentage of households with 3 or more vehicles available in the United States with a correlation coefficient (R) of 0.008 and weighted average of 10.1%. Similarly, the statistical analysis conducted on geographies consisting of 354,643,903 people shows a mild negative correlation between the proportion of Dominicans and percentage of households with 3 or more vehicles available in the United States with a correlation coefficient (R) of -0.396 and weighted average of 11.2%, a difference of 11.7%.
3 or more Vehicles in Household Correlation Summary
| Measurement | Immigrants from St. Vincent and the Grenadines | Dominican |
| Minimum | 0.62% | 0.12% |
| Maximum | 42.6% | 34.8% |
| Range | 42.0% | 34.6% |
| Mean | 18.1% | 10.9% |
| Median | 17.9% | 10.7% |
| Interquartile 25% (IQ1) | 10.3% | 6.2% |
| Interquartile 75% (IQ3) | 24.1% | 15.3% |
| Interquartile Range (IQR) | 13.8% | 9.1% |
| Standard Deviation (Sample) | 11.0% | 6.7% |
| Standard Deviation (Population) | 10.9% | 6.6% |
Demographics Similar to Immigrants from St. Vincent and the Grenadines and Dominicans by 3 or more Vehicles in Household
In terms of 3 or more vehicles in household, the demographic groups most similar to Immigrants from St. Vincent and the Grenadines are Immigrants from Dominican Republic (10.4%, a difference of 3.7%), Immigrants from Grenada (9.1%, a difference of 10.6%), Immigrants from Guyana (11.2%, a difference of 11.8%), British West Indian (11.4%, a difference of 13.9%), and Guyanese (11.5%, a difference of 13.9%). Similarly, the demographic groups most similar to Dominicans are Immigrants from Guyana (11.2%, a difference of 0.15%), British West Indian (11.4%, a difference of 2.0%), Guyanese (11.5%, a difference of 2.0%), Immigrants from Barbados (11.7%, a difference of 4.4%), and Immigrants from Uzbekistan (12.0%, a difference of 6.8%).
| Demographics | Rating | Rank | 3 or more Vehicles in Household |
| Immigrants | Albania | 0.0 /100 | #328 | Tragic 14.0% |
| Immigrants | Senegal | 0.0 /100 | #329 | Tragic 13.8% |
| West Indians | 0.0 /100 | #330 | Tragic 13.7% |
| Immigrants | Dominica | 0.0 /100 | #331 | Tragic 13.7% |
| Trinidadians and Tobagonians | 0.0 /100 | #332 | Tragic 13.6% |
| Immigrants | Cabo Verde | 0.0 /100 | #333 | Tragic 13.6% |
| Immigrants | Ecuador | 0.0 /100 | #334 | Tragic 13.4% |
| Immigrants | Trinidad and Tobago | 0.0 /100 | #335 | Tragic 13.3% |
| Barbadians | 0.0 /100 | #336 | Tragic 12.6% |
| Immigrants | Bangladesh | 0.0 /100 | #337 | Tragic 12.5% |
| Vietnamese | 0.0 /100 | #338 | Tragic 12.5% |
| Immigrants | Uzbekistan | 0.0 /100 | #339 | Tragic 12.0% |
| Immigrants | Barbados | 0.0 /100 | #340 | Tragic 11.7% |
| Guyanese | 0.0 /100 | #341 | Tragic 11.5% |
| British West Indians | 0.0 /100 | #342 | Tragic 11.4% |
| Immigrants | Guyana | 0.0 /100 | #343 | Tragic 11.2% |
| Dominicans | 0.0 /100 | #344 | Tragic 11.2% |
| Immigrants | Dominican Republic | 0.0 /100 | #345 | Tragic 10.4% |
| Immigrants | St. Vincent and the Grenadines | 0.0 /100 | #346 | Tragic 10.1% |
| Immigrants | Grenada | 0.0 /100 | #347 | Tragic 9.1% |