Central American Indian vs Somali 3 or more Vehicles in Household
COMPARE
Central American Indian
Somali
3 or more Vehicles in Household
3 or more Vehicles in Household Comparison
Central American Indians
Somalis
19.0%
3 OR MORE VEHICLES IN HOUSEHOLD
22.2/ 100
METRIC RATING
196th/ 347
METRIC RANK
16.2%
3 OR MORE VEHICLES IN HOUSEHOLD
0.0/ 100
METRIC RATING
306th/ 347
METRIC RANK
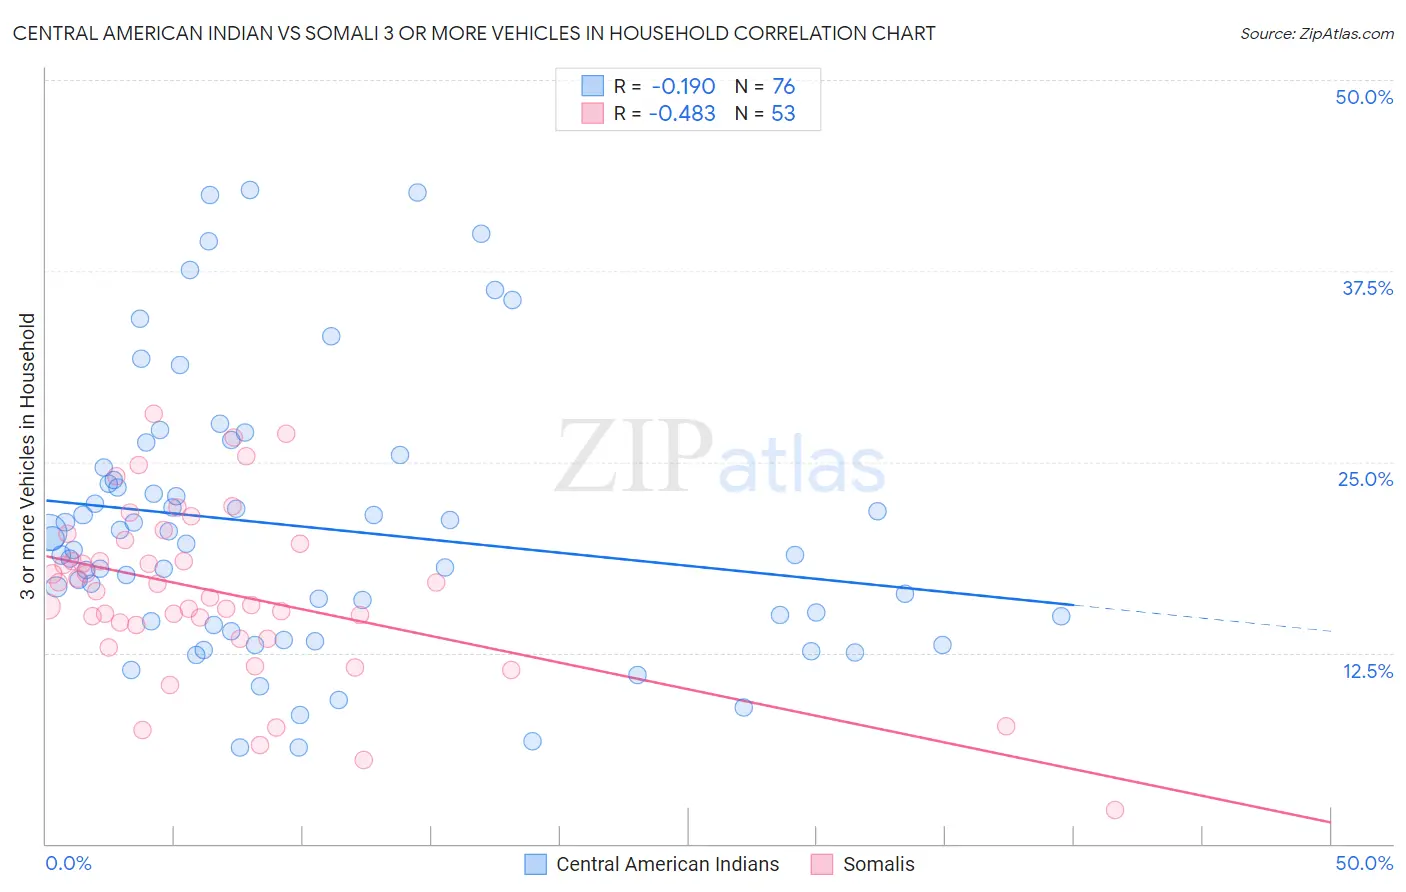
Central American Indian vs Somali 3 or more Vehicles in Household Correlation Chart
The statistical analysis conducted on geographies consisting of 326,022,544 people shows a poor negative correlation between the proportion of Central American Indians and percentage of households with 3 or more vehicles available in the United States with a correlation coefficient (R) of -0.190 and weighted average of 19.0%. Similarly, the statistical analysis conducted on geographies consisting of 99,282,686 people shows a moderate negative correlation between the proportion of Somalis and percentage of households with 3 or more vehicles available in the United States with a correlation coefficient (R) of -0.483 and weighted average of 16.2%, a difference of 17.7%.
3 or more Vehicles in Household Correlation Summary
| Measurement | Central American Indian | Somali |
| Minimum | 6.3% | 2.2% |
| Maximum | 42.8% | 28.2% |
| Range | 36.6% | 26.0% |
| Mean | 20.8% | 16.5% |
| Median | 19.4% | 16.5% |
| Interquartile 25% (IQ1) | 14.4% | 13.9% |
| Interquartile 75% (IQ3) | 24.2% | 19.8% |
| Interquartile Range (IQR) | 9.8% | 5.9% |
| Standard Deviation (Sample) | 8.9% | 5.5% |
| Standard Deviation (Population) | 8.8% | 5.5% |
Similar Demographics by 3 or more Vehicles in Household
Demographics Similar to Central American Indians by 3 or more Vehicles in Household
In terms of 3 or more vehicles in household, the demographic groups most similar to Central American Indians are Immigrants from Japan (19.0%, a difference of 0.030%), Immigrants from Moldova (19.1%, a difference of 0.15%), Serbian (19.1%, a difference of 0.19%), Tsimshian (19.1%, a difference of 0.23%), and Kenyan (19.1%, a difference of 0.27%).
| Demographics | Rating | Rank | 3 or more Vehicles in Household |
| Indians (Asian) | 26.0 /100 | #189 | Fair 19.1% |
| Immigrants | Zimbabwe | 25.5 /100 | #190 | Fair 19.1% |
| South American Indians | 25.4 /100 | #191 | Fair 19.1% |
| Kenyans | 24.7 /100 | #192 | Fair 19.1% |
| Tsimshian | 24.4 /100 | #193 | Fair 19.1% |
| Serbians | 24.0 /100 | #194 | Fair 19.1% |
| Immigrants | Moldova | 23.6 /100 | #195 | Fair 19.1% |
| Central American Indians | 22.2 /100 | #196 | Fair 19.0% |
| Immigrants | Japan | 22.0 /100 | #197 | Fair 19.0% |
| Egyptians | 19.5 /100 | #198 | Poor 19.0% |
| Immigrants | Norway | 19.0 /100 | #199 | Poor 19.0% |
| Argentineans | 18.2 /100 | #200 | Poor 18.9% |
| Arabs | 17.7 /100 | #201 | Poor 18.9% |
| Immigrants | Austria | 15.4 /100 | #202 | Poor 18.9% |
| Tohono O'odham | 14.8 /100 | #203 | Poor 18.9% |
Demographics Similar to Somalis by 3 or more Vehicles in Household
In terms of 3 or more vehicles in household, the demographic groups most similar to Somalis are Immigrants from Ghana (16.2%, a difference of 0.15%), Houma (16.1%, a difference of 0.74%), Immigrants from Morocco (16.3%, a difference of 0.82%), Ghanaian (16.4%, a difference of 1.1%), and Immigrants from Serbia (16.4%, a difference of 1.6%).
| Demographics | Rating | Rank | 3 or more Vehicles in Household |
| Immigrants | South America | 0.1 /100 | #299 | Tragic 16.7% |
| Cypriots | 0.0 /100 | #300 | Tragic 16.6% |
| Paraguayans | 0.0 /100 | #301 | Tragic 16.6% |
| Immigrants | Greece | 0.0 /100 | #302 | Tragic 16.5% |
| Immigrants | Serbia | 0.0 /100 | #303 | Tragic 16.4% |
| Ghanaians | 0.0 /100 | #304 | Tragic 16.4% |
| Immigrants | Morocco | 0.0 /100 | #305 | Tragic 16.3% |
| Somalis | 0.0 /100 | #306 | Tragic 16.2% |
| Immigrants | Ghana | 0.0 /100 | #307 | Tragic 16.2% |
| Houma | 0.0 /100 | #308 | Tragic 16.1% |
| Immigrants | Somalia | 0.0 /100 | #309 | Tragic 15.9% |
| Moroccans | 0.0 /100 | #310 | Tragic 15.9% |
| Albanians | 0.0 /100 | #311 | Tragic 15.8% |
| Puerto Ricans | 0.0 /100 | #312 | Tragic 15.6% |
| Immigrants | Israel | 0.0 /100 | #313 | Tragic 15.6% |