Cuban vs Dominican 3 or more Vehicles in Household
COMPARE
Cuban
Dominican
3 or more Vehicles in Household
3 or more Vehicles in Household Comparison
Cubans
Dominicans
19.3%
3 OR MORE VEHICLES IN HOUSEHOLD
36.6/ 100
METRIC RATING
182nd/ 347
METRIC RANK
11.2%
3 OR MORE VEHICLES IN HOUSEHOLD
0.0/ 100
METRIC RATING
344th/ 347
METRIC RANK
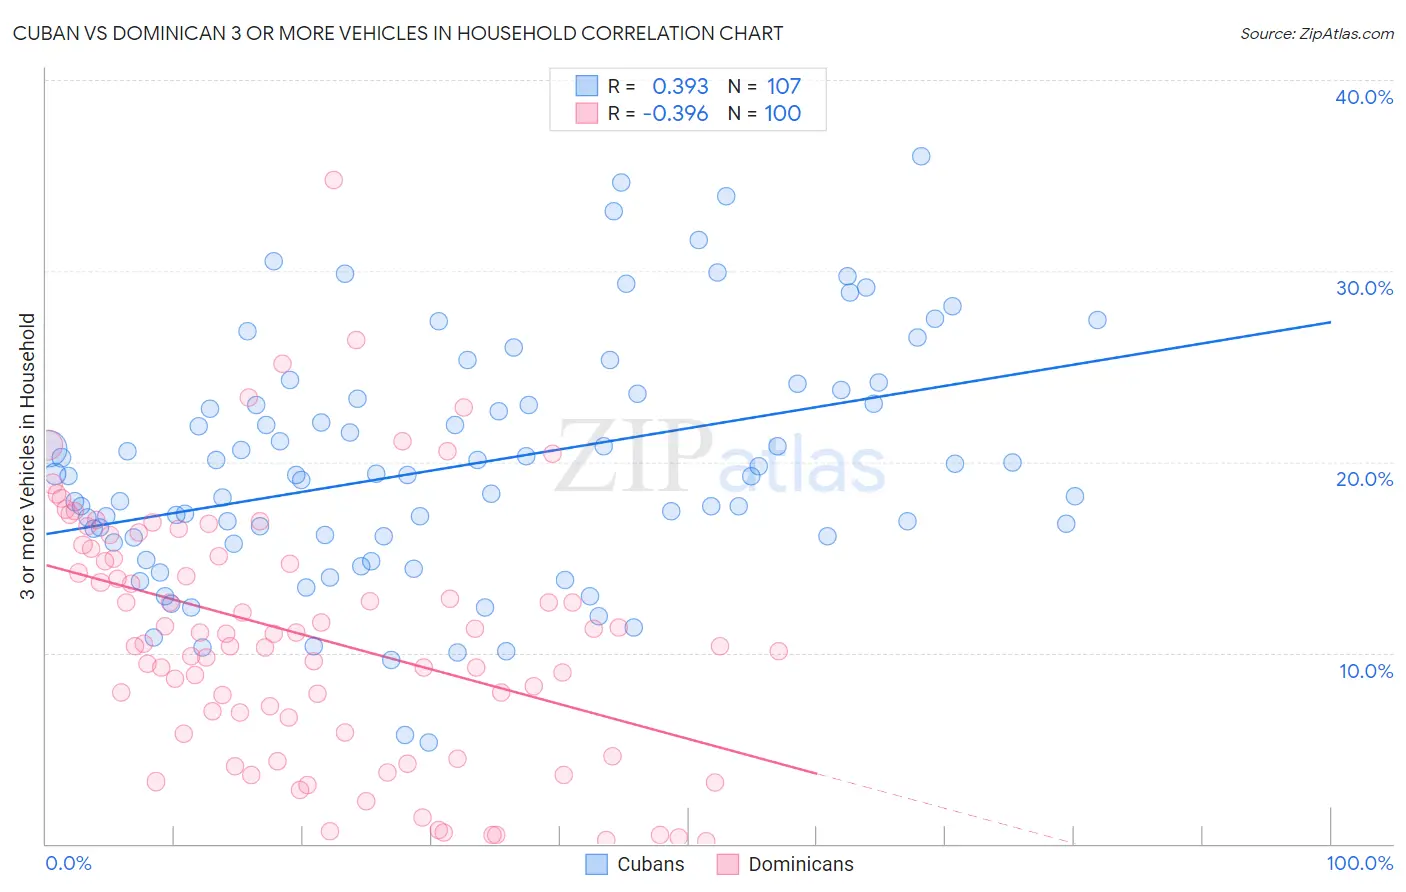
Cuban vs Dominican 3 or more Vehicles in Household Correlation Chart
The statistical analysis conducted on geographies consisting of 448,802,841 people shows a mild positive correlation between the proportion of Cubans and percentage of households with 3 or more vehicles available in the United States with a correlation coefficient (R) of 0.393 and weighted average of 19.3%. Similarly, the statistical analysis conducted on geographies consisting of 354,643,903 people shows a mild negative correlation between the proportion of Dominicans and percentage of households with 3 or more vehicles available in the United States with a correlation coefficient (R) of -0.396 and weighted average of 11.2%, a difference of 71.9%.
3 or more Vehicles in Household Correlation Summary
| Measurement | Cuban | Dominican |
| Minimum | 5.3% | 0.12% |
| Maximum | 36.0% | 34.8% |
| Range | 30.7% | 34.6% |
| Mean | 19.8% | 10.9% |
| Median | 19.3% | 10.7% |
| Interquartile 25% (IQ1) | 16.0% | 6.2% |
| Interquartile 75% (IQ3) | 23.3% | 15.3% |
| Interquartile Range (IQR) | 7.3% | 9.1% |
| Standard Deviation (Sample) | 6.3% | 6.7% |
| Standard Deviation (Population) | 6.2% | 6.6% |
Similar Demographics by 3 or more Vehicles in Household
Demographics Similar to Cubans by 3 or more Vehicles in Household
In terms of 3 or more vehicles in household, the demographic groups most similar to Cubans are Romanian (19.3%, a difference of 0.040%), Cajun (19.3%, a difference of 0.050%), South African (19.3%, a difference of 0.070%), Latvian (19.3%, a difference of 0.070%), and Immigrants from South Central Asia (19.3%, a difference of 0.19%).
| Demographics | Rating | Rank | 3 or more Vehicles in Household |
| Syrians | 47.0 /100 | #175 | Average 19.5% |
| Iroquois | 46.0 /100 | #176 | Average 19.4% |
| Immigrants | Peru | 41.1 /100 | #177 | Average 19.4% |
| Immigrants | Syria | 40.3 /100 | #178 | Average 19.4% |
| Immigrants | South Central Asia | 38.9 /100 | #179 | Fair 19.3% |
| South Africans | 37.5 /100 | #180 | Fair 19.3% |
| Romanians | 37.1 /100 | #181 | Fair 19.3% |
| Cubans | 36.6 /100 | #182 | Fair 19.3% |
| Cajuns | 36.0 /100 | #183 | Fair 19.3% |
| Latvians | 35.7 /100 | #184 | Fair 19.3% |
| Immigrants | Sri Lanka | 30.7 /100 | #185 | Fair 19.2% |
| Immigrants | Sweden | 29.0 /100 | #186 | Fair 19.2% |
| Immigrants | Hong Kong | 28.3 /100 | #187 | Fair 19.2% |
| Immigrants | Kuwait | 26.1 /100 | #188 | Fair 19.1% |
| Indians (Asian) | 26.0 /100 | #189 | Fair 19.1% |
Demographics Similar to Dominicans by 3 or more Vehicles in Household
In terms of 3 or more vehicles in household, the demographic groups most similar to Dominicans are Immigrants from Guyana (11.2%, a difference of 0.15%), British West Indian (11.4%, a difference of 2.0%), Guyanese (11.5%, a difference of 2.0%), Immigrants from Barbados (11.7%, a difference of 4.4%), and Immigrants from Uzbekistan (12.0%, a difference of 6.8%).
| Demographics | Rating | Rank | 3 or more Vehicles in Household |
| Immigrants | Cabo Verde | 0.0 /100 | #333 | Tragic 13.6% |
| Immigrants | Ecuador | 0.0 /100 | #334 | Tragic 13.4% |
| Immigrants | Trinidad and Tobago | 0.0 /100 | #335 | Tragic 13.3% |
| Barbadians | 0.0 /100 | #336 | Tragic 12.6% |
| Immigrants | Bangladesh | 0.0 /100 | #337 | Tragic 12.5% |
| Vietnamese | 0.0 /100 | #338 | Tragic 12.5% |
| Immigrants | Uzbekistan | 0.0 /100 | #339 | Tragic 12.0% |
| Immigrants | Barbados | 0.0 /100 | #340 | Tragic 11.7% |
| Guyanese | 0.0 /100 | #341 | Tragic 11.5% |
| British West Indians | 0.0 /100 | #342 | Tragic 11.4% |
| Immigrants | Guyana | 0.0 /100 | #343 | Tragic 11.2% |
| Dominicans | 0.0 /100 | #344 | Tragic 11.2% |
| Immigrants | Dominican Republic | 0.0 /100 | #345 | Tragic 10.4% |
| Immigrants | St. Vincent and the Grenadines | 0.0 /100 | #346 | Tragic 10.1% |
| Immigrants | Grenada | 0.0 /100 | #347 | Tragic 9.1% |