Celtic vs Immigrants from India 3 or more Vehicles in Household
COMPARE
Celtic
Immigrants from India
3 or more Vehicles in Household
3 or more Vehicles in Household Comparison
Celtics
Immigrants from India
21.7%
3 OR MORE VEHICLES IN HOUSEHOLD
99.7/ 100
METRIC RATING
81st/ 347
METRIC RANK
20.2%
3 OR MORE VEHICLES IN HOUSEHOLD
87.2/ 100
METRIC RATING
135th/ 347
METRIC RANK
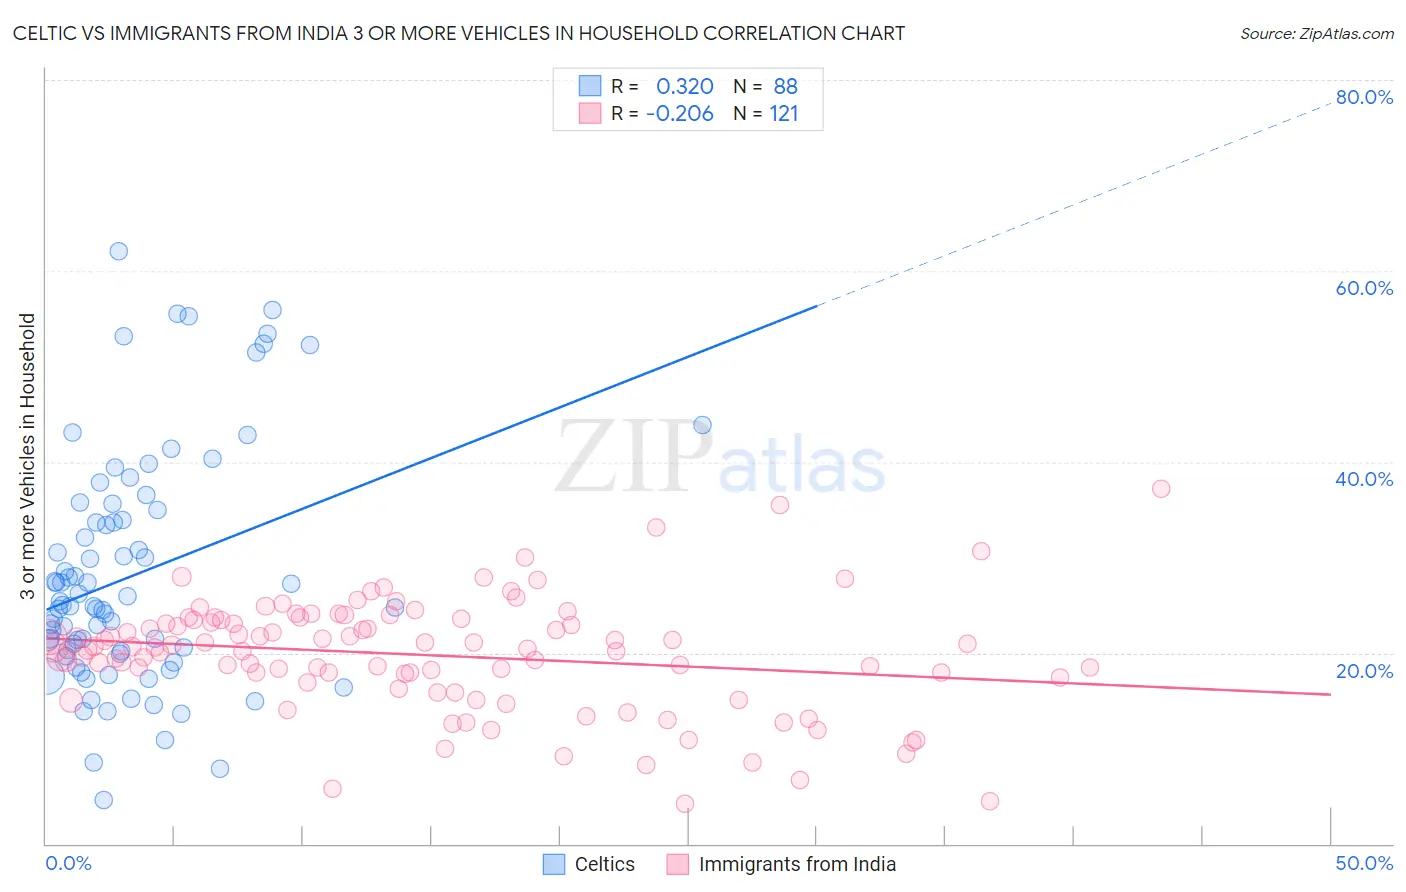
Celtic vs Immigrants from India 3 or more Vehicles in Household Correlation Chart
The statistical analysis conducted on geographies consisting of 168,856,114 people shows a mild positive correlation between the proportion of Celtics and percentage of households with 3 or more vehicles available in the United States with a correlation coefficient (R) of 0.320 and weighted average of 21.7%. Similarly, the statistical analysis conducted on geographies consisting of 433,547,679 people shows a weak negative correlation between the proportion of Immigrants from India and percentage of households with 3 or more vehicles available in the United States with a correlation coefficient (R) of -0.206 and weighted average of 20.2%, a difference of 7.2%.
3 or more Vehicles in Household Correlation Summary
| Measurement | Celtic | Immigrants from India |
| Minimum | 4.5% | 4.1% |
| Maximum | 62.1% | 37.1% |
| Range | 57.5% | 33.0% |
| Mean | 28.1% | 19.8% |
| Median | 25.0% | 20.5% |
| Interquartile 25% (IQ1) | 20.0% | 17.2% |
| Interquartile 75% (IQ3) | 34.4% | 23.4% |
| Interquartile Range (IQR) | 14.4% | 6.2% |
| Standard Deviation (Sample) | 12.3% | 5.9% |
| Standard Deviation (Population) | 12.2% | 5.9% |
Similar Demographics by 3 or more Vehicles in Household
Demographics Similar to Celtics by 3 or more Vehicles in Household
In terms of 3 or more vehicles in household, the demographic groups most similar to Celtics are Afghan (21.7%, a difference of 0.070%), Czechoslovakian (21.7%, a difference of 0.28%), Assyrian/Chaldean/Syriac (21.7%, a difference of 0.28%), Irish (21.8%, a difference of 0.41%), and Nonimmigrants (21.8%, a difference of 0.48%).
| Demographics | Rating | Rank | 3 or more Vehicles in Household |
| Immigrants | Oceania | 99.8 /100 | #74 | Exceptional 21.8% |
| Japanese | 99.8 /100 | #75 | Exceptional 21.8% |
| Immigrants | Nonimmigrants | 99.8 /100 | #76 | Exceptional 21.8% |
| Irish | 99.8 /100 | #77 | Exceptional 21.8% |
| Czechoslovakians | 99.8 /100 | #78 | Exceptional 21.7% |
| Assyrians/Chaldeans/Syriacs | 99.8 /100 | #79 | Exceptional 21.7% |
| Afghans | 99.7 /100 | #80 | Exceptional 21.7% |
| Celtics | 99.7 /100 | #81 | Exceptional 21.7% |
| Immigrants | El Salvador | 99.6 /100 | #82 | Exceptional 21.5% |
| Chippewa | 99.6 /100 | #83 | Exceptional 21.5% |
| Icelanders | 99.6 /100 | #84 | Exceptional 21.5% |
| Laotians | 99.6 /100 | #85 | Exceptional 21.5% |
| Delaware | 99.6 /100 | #86 | Exceptional 21.5% |
| Immigrants | Azores | 99.5 /100 | #87 | Exceptional 21.5% |
| French | 99.4 /100 | #88 | Exceptional 21.4% |
Demographics Similar to Immigrants from India by 3 or more Vehicles in Household
In terms of 3 or more vehicles in household, the demographic groups most similar to Immigrants from India are Immigrants from Nicaragua (20.2%, a difference of 0.010%), Immigrants from Iraq (20.2%, a difference of 0.010%), Polish (20.2%, a difference of 0.020%), Immigrants from Canada (20.2%, a difference of 0.11%), and Immigrants from North America (20.2%, a difference of 0.11%).
| Demographics | Rating | Rank | 3 or more Vehicles in Household |
| New Zealanders | 91.3 /100 | #128 | Exceptional 20.4% |
| Zimbabweans | 88.7 /100 | #129 | Excellent 20.3% |
| Greeks | 88.6 /100 | #130 | Excellent 20.3% |
| Immigrants | Asia | 88.1 /100 | #131 | Excellent 20.2% |
| Immigrants | Canada | 87.8 /100 | #132 | Excellent 20.2% |
| Immigrants | North America | 87.8 /100 | #133 | Excellent 20.2% |
| Poles | 87.3 /100 | #134 | Excellent 20.2% |
| Immigrants | India | 87.2 /100 | #135 | Excellent 20.2% |
| Immigrants | Nicaragua | 87.1 /100 | #136 | Excellent 20.2% |
| Immigrants | Iraq | 87.1 /100 | #137 | Excellent 20.2% |
| Aleuts | 86.3 /100 | #138 | Excellent 20.2% |
| Slovenes | 85.5 /100 | #139 | Excellent 20.2% |
| French American Indians | 85.3 /100 | #140 | Excellent 20.1% |
| Ottawa | 84.9 /100 | #141 | Excellent 20.1% |
| Jordanians | 84.4 /100 | #142 | Excellent 20.1% |