Bermudan vs Immigrants from India 3 or more Vehicles in Household
COMPARE
Bermudan
Immigrants from India
3 or more Vehicles in Household
3 or more Vehicles in Household Comparison
Bermudans
Immigrants from India
17.8%
3 OR MORE VEHICLES IN HOUSEHOLD
0.9/ 100
METRIC RATING
263rd/ 347
METRIC RANK
20.2%
3 OR MORE VEHICLES IN HOUSEHOLD
87.2/ 100
METRIC RATING
135th/ 347
METRIC RANK
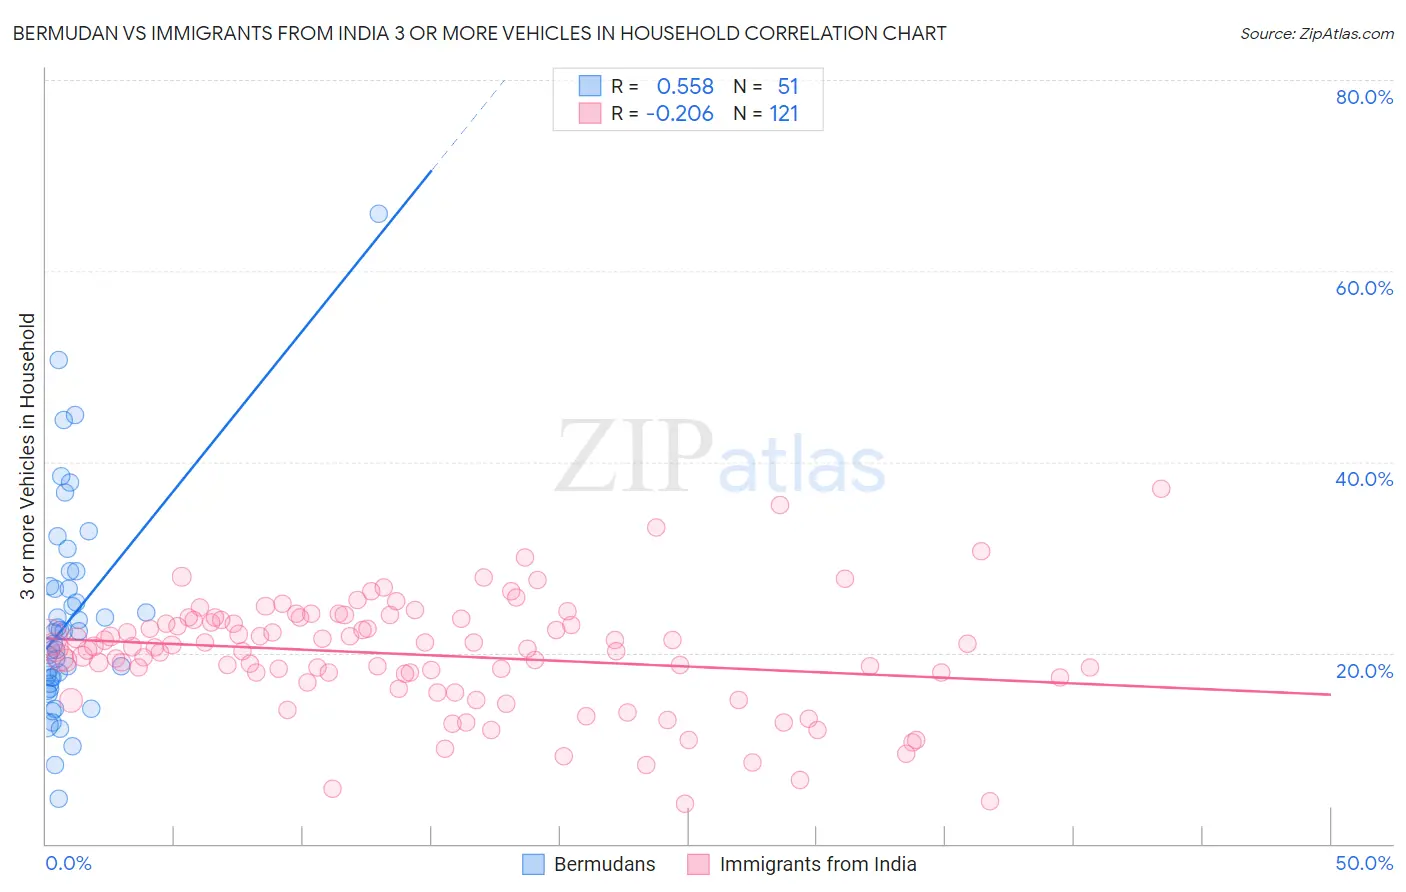
Bermudan vs Immigrants from India 3 or more Vehicles in Household Correlation Chart
The statistical analysis conducted on geographies consisting of 55,710,520 people shows a substantial positive correlation between the proportion of Bermudans and percentage of households with 3 or more vehicles available in the United States with a correlation coefficient (R) of 0.558 and weighted average of 17.8%. Similarly, the statistical analysis conducted on geographies consisting of 433,547,679 people shows a weak negative correlation between the proportion of Immigrants from India and percentage of households with 3 or more vehicles available in the United States with a correlation coefficient (R) of -0.206 and weighted average of 20.2%, a difference of 13.8%.
3 or more Vehicles in Household Correlation Summary
| Measurement | Bermudan | Immigrants from India |
| Minimum | 4.8% | 4.1% |
| Maximum | 66.0% | 37.1% |
| Range | 61.2% | 33.0% |
| Mean | 23.6% | 19.8% |
| Median | 22.1% | 20.5% |
| Interquartile 25% (IQ1) | 16.7% | 17.2% |
| Interquartile 75% (IQ3) | 27.0% | 23.4% |
| Interquartile Range (IQR) | 10.3% | 6.2% |
| Standard Deviation (Sample) | 11.2% | 5.9% |
| Standard Deviation (Population) | 11.1% | 5.9% |
Similar Demographics by 3 or more Vehicles in Household
Demographics Similar to Bermudans by 3 or more Vehicles in Household
In terms of 3 or more vehicles in household, the demographic groups most similar to Bermudans are Cambodian (17.8%, a difference of 0.030%), Colombian (17.8%, a difference of 0.11%), Immigrants from Northern Africa (17.8%, a difference of 0.14%), Ugandan (17.8%, a difference of 0.16%), and Immigrants from Panama (17.7%, a difference of 0.16%).
| Demographics | Rating | Rank | 3 or more Vehicles in Household |
| Sub-Saharan Africans | 1.1 /100 | #256 | Tragic 17.9% |
| Immigrants | Eritrea | 1.1 /100 | #257 | Tragic 17.8% |
| Sudanese | 1.1 /100 | #258 | Tragic 17.8% |
| Uruguayans | 1.0 /100 | #259 | Tragic 17.8% |
| Ugandans | 0.9 /100 | #260 | Tragic 17.8% |
| Immigrants | Northern Africa | 0.9 /100 | #261 | Tragic 17.8% |
| Colombians | 0.9 /100 | #262 | Tragic 17.8% |
| Bermudans | 0.9 /100 | #263 | Tragic 17.8% |
| Cambodians | 0.9 /100 | #264 | Tragic 17.8% |
| Immigrants | Panama | 0.8 /100 | #265 | Tragic 17.7% |
| Macedonians | 0.8 /100 | #266 | Tragic 17.7% |
| Immigrants | Venezuela | 0.8 /100 | #267 | Tragic 17.7% |
| Immigrants | Bulgaria | 0.8 /100 | #268 | Tragic 17.7% |
| Immigrants | France | 0.6 /100 | #269 | Tragic 17.6% |
| Immigrants | Nepal | 0.6 /100 | #270 | Tragic 17.6% |
Demographics Similar to Immigrants from India by 3 or more Vehicles in Household
In terms of 3 or more vehicles in household, the demographic groups most similar to Immigrants from India are Immigrants from Nicaragua (20.2%, a difference of 0.010%), Immigrants from Iraq (20.2%, a difference of 0.010%), Polish (20.2%, a difference of 0.020%), Immigrants from Canada (20.2%, a difference of 0.11%), and Immigrants from North America (20.2%, a difference of 0.11%).
| Demographics | Rating | Rank | 3 or more Vehicles in Household |
| New Zealanders | 91.3 /100 | #128 | Exceptional 20.4% |
| Zimbabweans | 88.7 /100 | #129 | Excellent 20.3% |
| Greeks | 88.6 /100 | #130 | Excellent 20.3% |
| Immigrants | Asia | 88.1 /100 | #131 | Excellent 20.2% |
| Immigrants | Canada | 87.8 /100 | #132 | Excellent 20.2% |
| Immigrants | North America | 87.8 /100 | #133 | Excellent 20.2% |
| Poles | 87.3 /100 | #134 | Excellent 20.2% |
| Immigrants | India | 87.2 /100 | #135 | Excellent 20.2% |
| Immigrants | Nicaragua | 87.1 /100 | #136 | Excellent 20.2% |
| Immigrants | Iraq | 87.1 /100 | #137 | Excellent 20.2% |
| Aleuts | 86.3 /100 | #138 | Excellent 20.2% |
| Slovenes | 85.5 /100 | #139 | Excellent 20.2% |
| French American Indians | 85.3 /100 | #140 | Excellent 20.1% |
| Ottawa | 84.9 /100 | #141 | Excellent 20.1% |
| Jordanians | 84.4 /100 | #142 | Excellent 20.1% |