Celtic vs Immigrants from India Hearing Disability
COMPARE
Celtic
Immigrants from India
Hearing Disability
Hearing Disability Comparison
Celtics
Immigrants from India
3.7%
HEARING DISABILITY
0.0/ 100
METRIC RATING
298th/ 347
METRIC RANK
2.5%
HEARING DISABILITY
99.9/ 100
METRIC RATING
17th/ 347
METRIC RANK
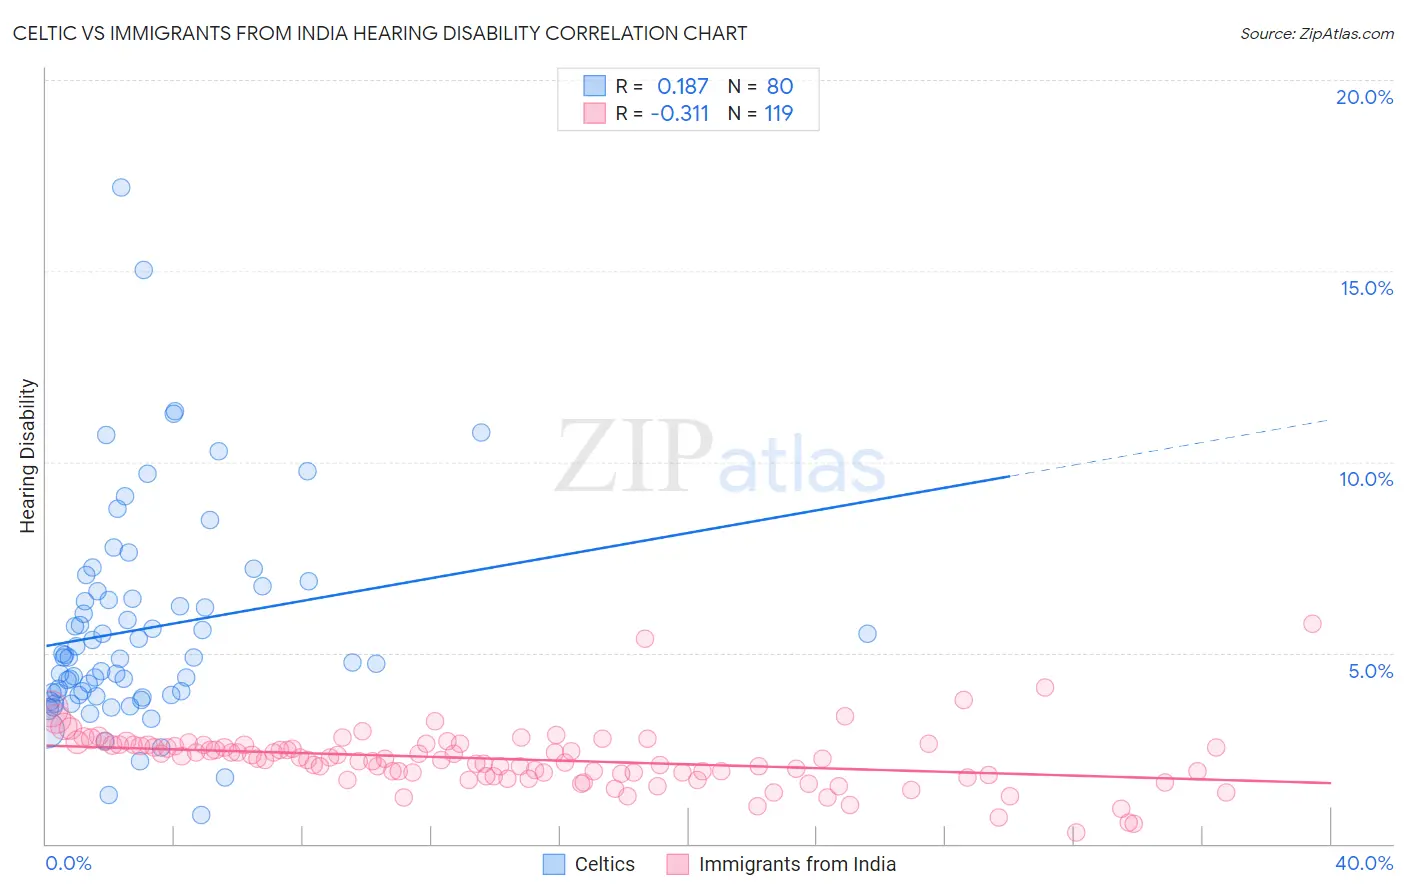
Celtic vs Immigrants from India Hearing Disability Correlation Chart
The statistical analysis conducted on geographies consisting of 168,857,428 people shows a poor positive correlation between the proportion of Celtics and percentage of population with hearing disability in the United States with a correlation coefficient (R) of 0.187 and weighted average of 3.7%. Similarly, the statistical analysis conducted on geographies consisting of 433,914,336 people shows a mild negative correlation between the proportion of Immigrants from India and percentage of population with hearing disability in the United States with a correlation coefficient (R) of -0.311 and weighted average of 2.5%, a difference of 47.2%.
Hearing Disability Correlation Summary
| Measurement | Celtic | Immigrants from India |
| Minimum | 0.76% | 0.30% |
| Maximum | 17.2% | 5.8% |
| Range | 16.4% | 5.5% |
| Mean | 5.6% | 2.2% |
| Median | 4.9% | 2.2% |
| Interquartile 25% (IQ1) | 3.9% | 1.8% |
| Interquartile 75% (IQ3) | 6.5% | 2.6% |
| Interquartile Range (IQR) | 2.6% | 0.78% |
| Standard Deviation (Sample) | 2.8% | 0.78% |
| Standard Deviation (Population) | 2.8% | 0.77% |
Similar Demographics by Hearing Disability
Demographics Similar to Celtics by Hearing Disability
In terms of hearing disability, the demographic groups most similar to Celtics are Immigrants from the Azores (3.7%, a difference of 0.19%), Pima (3.7%, a difference of 0.26%), German (3.7%, a difference of 0.28%), Scottish (3.7%, a difference of 0.34%), and Pennsylvania German (3.7%, a difference of 0.37%).
| Demographics | Rating | Rank | Hearing Disability |
| Finns | 0.0 /100 | #291 | Tragic 3.7% |
| Native Hawaiians | 0.0 /100 | #292 | Tragic 3.7% |
| Norwegians | 0.0 /100 | #293 | Tragic 3.7% |
| Iroquois | 0.0 /100 | #294 | Tragic 3.7% |
| Welsh | 0.0 /100 | #295 | Tragic 3.7% |
| Pima | 0.0 /100 | #296 | Tragic 3.7% |
| Immigrants | Azores | 0.0 /100 | #297 | Tragic 3.7% |
| Celtics | 0.0 /100 | #298 | Tragic 3.7% |
| Germans | 0.0 /100 | #299 | Tragic 3.7% |
| Scottish | 0.0 /100 | #300 | Tragic 3.7% |
| Pennsylvania Germans | 0.0 /100 | #301 | Tragic 3.7% |
| Dutch | 0.0 /100 | #302 | Tragic 3.7% |
| Menominee | 0.0 /100 | #303 | Tragic 3.7% |
| French | 0.0 /100 | #304 | Tragic 3.8% |
| English | 0.0 /100 | #305 | Tragic 3.8% |
Demographics Similar to Immigrants from India by Hearing Disability
In terms of hearing disability, the demographic groups most similar to Immigrants from India are Immigrants from West Indies (2.5%, a difference of 0.32%), Barbadian (2.5%, a difference of 0.47%), Dominican (2.5%, a difference of 0.69%), Thai (2.5%, a difference of 0.72%), and Ecuadorian (2.5%, a difference of 0.77%).
| Demographics | Rating | Rank | Hearing Disability |
| Immigrants | Ecuador | 99.9 /100 | #10 | Exceptional 2.5% |
| Immigrants | Trinidad and Tobago | 99.9 /100 | #11 | Exceptional 2.5% |
| Trinidadians and Tobagonians | 99.9 /100 | #12 | Exceptional 2.5% |
| Sierra Leoneans | 99.9 /100 | #13 | Exceptional 2.5% |
| Ecuadorians | 99.9 /100 | #14 | Exceptional 2.5% |
| Barbadians | 99.9 /100 | #15 | Exceptional 2.5% |
| Immigrants | West Indies | 99.9 /100 | #16 | Exceptional 2.5% |
| Immigrants | India | 99.9 /100 | #17 | Exceptional 2.5% |
| Dominicans | 99.8 /100 | #18 | Exceptional 2.5% |
| Thais | 99.8 /100 | #19 | Exceptional 2.5% |
| Immigrants | Bolivia | 99.8 /100 | #20 | Exceptional 2.5% |
| Ghanaians | 99.8 /100 | #21 | Exceptional 2.5% |
| Immigrants | Sierra Leone | 99.8 /100 | #22 | Exceptional 2.6% |
| Immigrants | Nigeria | 99.8 /100 | #23 | Exceptional 2.6% |
| Immigrants | Ghana | 99.8 /100 | #24 | Exceptional 2.6% |