Celtic vs Costa Rican 3 or more Vehicles in Household
COMPARE
Celtic
Costa Rican
3 or more Vehicles in Household
3 or more Vehicles in Household Comparison
Celtics
Costa Ricans
21.7%
3 OR MORE VEHICLES IN HOUSEHOLD
99.7/ 100
METRIC RATING
81st/ 347
METRIC RANK
20.6%
3 OR MORE VEHICLES IN HOUSEHOLD
94.6/ 100
METRIC RATING
118th/ 347
METRIC RANK
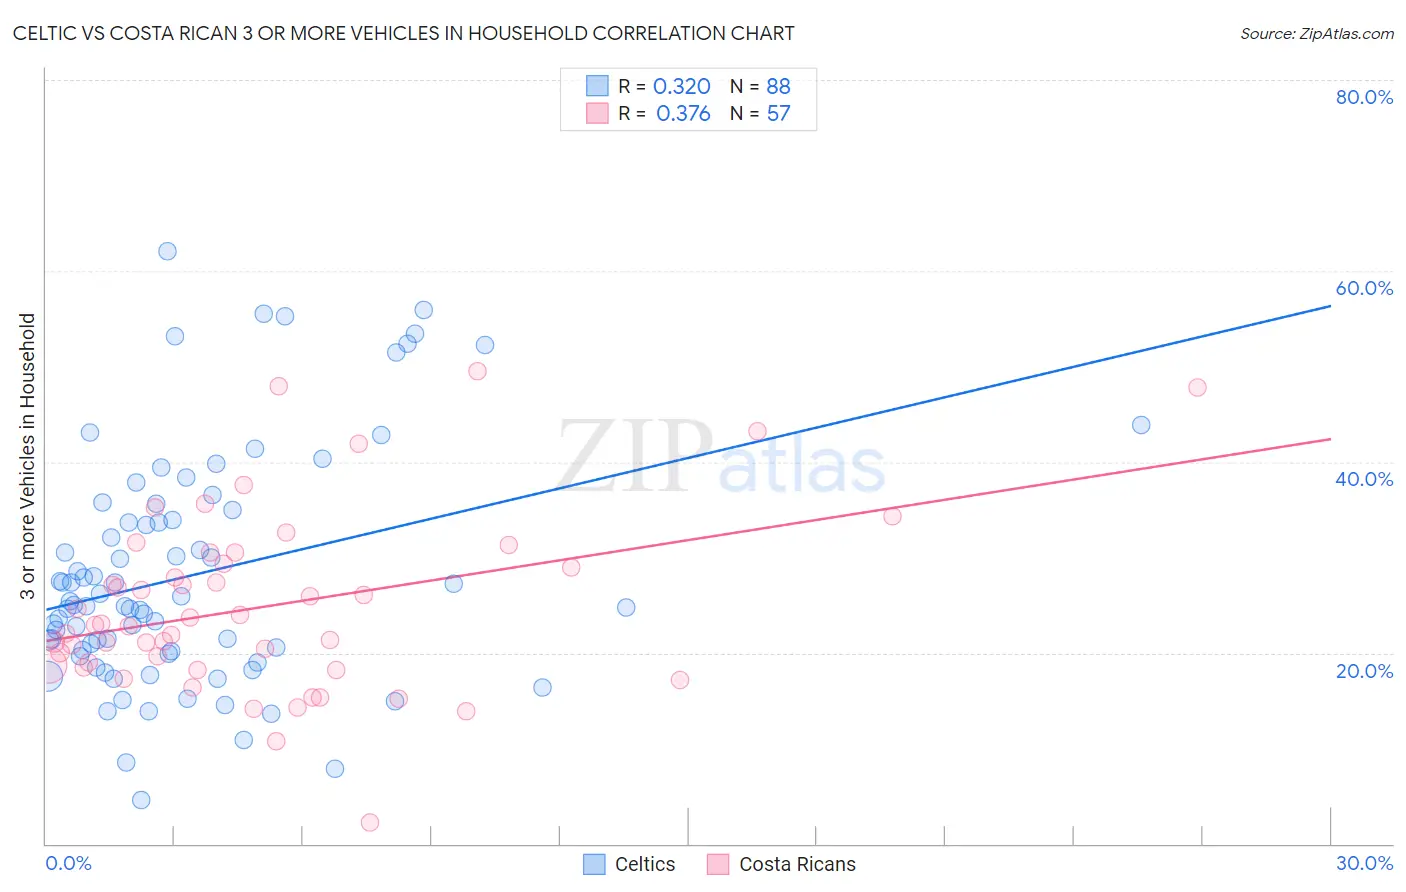
Celtic vs Costa Rican 3 or more Vehicles in Household Correlation Chart
The statistical analysis conducted on geographies consisting of 168,856,114 people shows a mild positive correlation between the proportion of Celtics and percentage of households with 3 or more vehicles available in the United States with a correlation coefficient (R) of 0.320 and weighted average of 21.7%. Similarly, the statistical analysis conducted on geographies consisting of 253,426,253 people shows a mild positive correlation between the proportion of Costa Ricans and percentage of households with 3 or more vehicles available in the United States with a correlation coefficient (R) of 0.376 and weighted average of 20.6%, a difference of 5.4%.
3 or more Vehicles in Household Correlation Summary
| Measurement | Celtic | Costa Rican |
| Minimum | 4.5% | 2.2% |
| Maximum | 62.1% | 49.4% |
| Range | 57.5% | 47.2% |
| Mean | 28.1% | 24.9% |
| Median | 25.0% | 22.9% |
| Interquartile 25% (IQ1) | 20.0% | 18.6% |
| Interquartile 75% (IQ3) | 34.4% | 29.9% |
| Interquartile Range (IQR) | 14.4% | 11.3% |
| Standard Deviation (Sample) | 12.3% | 9.4% |
| Standard Deviation (Population) | 12.2% | 9.3% |
Similar Demographics by 3 or more Vehicles in Household
Demographics Similar to Celtics by 3 or more Vehicles in Household
In terms of 3 or more vehicles in household, the demographic groups most similar to Celtics are Afghan (21.7%, a difference of 0.070%), Czechoslovakian (21.7%, a difference of 0.28%), Assyrian/Chaldean/Syriac (21.7%, a difference of 0.28%), Irish (21.8%, a difference of 0.41%), and Nonimmigrants (21.8%, a difference of 0.48%).
| Demographics | Rating | Rank | 3 or more Vehicles in Household |
| Immigrants | Oceania | 99.8 /100 | #74 | Exceptional 21.8% |
| Japanese | 99.8 /100 | #75 | Exceptional 21.8% |
| Immigrants | Nonimmigrants | 99.8 /100 | #76 | Exceptional 21.8% |
| Irish | 99.8 /100 | #77 | Exceptional 21.8% |
| Czechoslovakians | 99.8 /100 | #78 | Exceptional 21.7% |
| Assyrians/Chaldeans/Syriacs | 99.8 /100 | #79 | Exceptional 21.7% |
| Afghans | 99.7 /100 | #80 | Exceptional 21.7% |
| Celtics | 99.7 /100 | #81 | Exceptional 21.7% |
| Immigrants | El Salvador | 99.6 /100 | #82 | Exceptional 21.5% |
| Chippewa | 99.6 /100 | #83 | Exceptional 21.5% |
| Icelanders | 99.6 /100 | #84 | Exceptional 21.5% |
| Laotians | 99.6 /100 | #85 | Exceptional 21.5% |
| Delaware | 99.6 /100 | #86 | Exceptional 21.5% |
| Immigrants | Azores | 99.5 /100 | #87 | Exceptional 21.5% |
| French | 99.4 /100 | #88 | Exceptional 21.4% |
Demographics Similar to Costa Ricans by 3 or more Vehicles in Household
In terms of 3 or more vehicles in household, the demographic groups most similar to Costa Ricans are Immigrants from Latin America (20.5%, a difference of 0.040%), Croatian (20.6%, a difference of 0.11%), Italian (20.6%, a difference of 0.13%), French Canadian (20.6%, a difference of 0.16%), and Maltese (20.5%, a difference of 0.23%).
| Demographics | Rating | Rank | 3 or more Vehicles in Household |
| Immigrants | Micronesia | 96.7 /100 | #111 | Exceptional 20.7% |
| Nicaraguans | 96.2 /100 | #112 | Exceptional 20.7% |
| Immigrants | England | 96.2 /100 | #113 | Exceptional 20.7% |
| Burmese | 95.8 /100 | #114 | Exceptional 20.6% |
| French Canadians | 95.0 /100 | #115 | Exceptional 20.6% |
| Italians | 94.9 /100 | #116 | Exceptional 20.6% |
| Croatians | 94.9 /100 | #117 | Exceptional 20.6% |
| Costa Ricans | 94.6 /100 | #118 | Exceptional 20.6% |
| Immigrants | Latin America | 94.5 /100 | #119 | Exceptional 20.5% |
| Maltese | 93.9 /100 | #120 | Exceptional 20.5% |
| Immigrants | Thailand | 93.8 /100 | #121 | Exceptional 20.5% |
| German Russians | 93.7 /100 | #122 | Exceptional 20.5% |
| Immigrants | Korea | 93.7 /100 | #123 | Exceptional 20.5% |
| Central Americans | 93.1 /100 | #124 | Exceptional 20.5% |
| Immigrants | Netherlands | 92.9 /100 | #125 | Exceptional 20.4% |