Celtic vs Immigrants from India 10th Grade
COMPARE
Celtic
Immigrants from India
10th Grade
10th Grade Comparison
Celtics
Immigrants from India
95.0%
10TH GRADE
99.8/ 100
METRIC RATING
59th/ 347
METRIC RANK
95.3%
10TH GRADE
99.9/ 100
METRIC RATING
36th/ 347
METRIC RANK
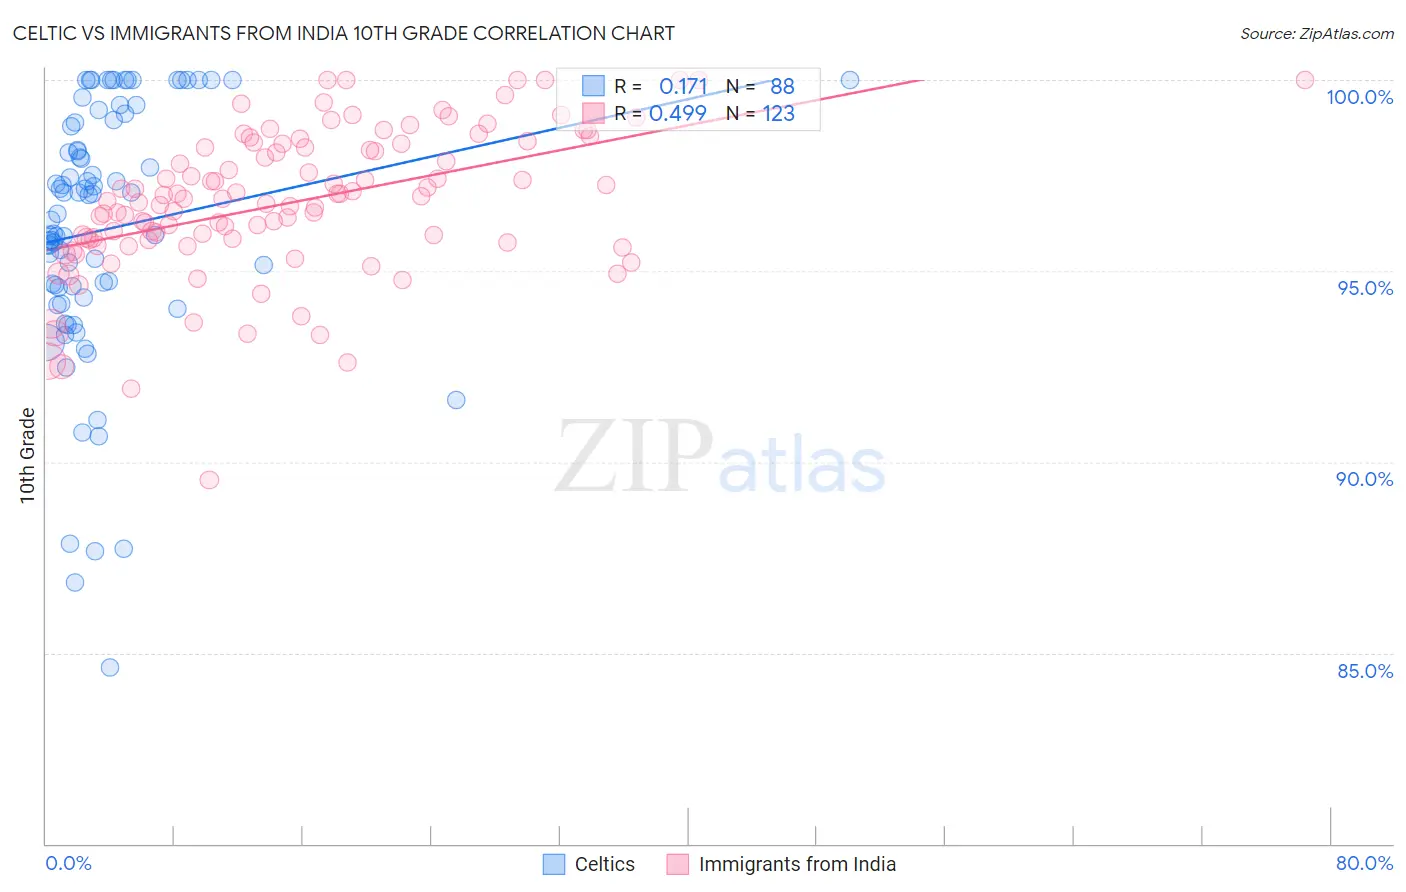
Celtic vs Immigrants from India 10th Grade Correlation Chart
The statistical analysis conducted on geographies consisting of 168,876,981 people shows a poor positive correlation between the proportion of Celtics and percentage of population with at least 10th grade education in the United States with a correlation coefficient (R) of 0.171 and weighted average of 95.0%. Similarly, the statistical analysis conducted on geographies consisting of 434,105,844 people shows a moderate positive correlation between the proportion of Immigrants from India and percentage of population with at least 10th grade education in the United States with a correlation coefficient (R) of 0.499 and weighted average of 95.3%, a difference of 0.31%.
10th Grade Correlation Summary
| Measurement | Celtic | Immigrants from India |
| Minimum | 84.6% | 89.5% |
| Maximum | 100.0% | 100.0% |
| Range | 15.4% | 10.5% |
| Mean | 96.1% | 96.8% |
| Median | 96.8% | 96.9% |
| Interquartile 25% (IQ1) | 94.4% | 95.8% |
| Interquartile 75% (IQ3) | 98.9% | 98.3% |
| Interquartile Range (IQR) | 4.5% | 2.5% |
| Standard Deviation (Sample) | 3.4% | 1.9% |
| Standard Deviation (Population) | 3.4% | 1.9% |
Similar Demographics by 10th Grade
Demographics Similar to Celtics by 10th Grade
In terms of 10th grade, the demographic groups most similar to Celtics are Aleut (95.0%, a difference of 0.0%), Immigrants from Ireland (95.0%, a difference of 0.010%), New Zealander (95.0%, a difference of 0.010%), Ukrainian (95.0%, a difference of 0.010%), and Cypriot (95.0%, a difference of 0.010%).
| Demographics | Rating | Rank | 10th Grade |
| Ottawa | 99.8 /100 | #52 | Exceptional 95.1% |
| Immigrants | North America | 99.8 /100 | #53 | Exceptional 95.0% |
| Immigrants | Lithuania | 99.8 /100 | #54 | Exceptional 95.0% |
| Immigrants | Ireland | 99.8 /100 | #55 | Exceptional 95.0% |
| New Zealanders | 99.8 /100 | #56 | Exceptional 95.0% |
| Ukrainians | 99.8 /100 | #57 | Exceptional 95.0% |
| Aleuts | 99.8 /100 | #58 | Exceptional 95.0% |
| Celtics | 99.8 /100 | #59 | Exceptional 95.0% |
| Cypriots | 99.8 /100 | #60 | Exceptional 95.0% |
| Chippewa | 99.8 /100 | #61 | Exceptional 95.0% |
| Thais | 99.8 /100 | #62 | Exceptional 95.0% |
| Immigrants | Singapore | 99.8 /100 | #63 | Exceptional 95.0% |
| Native Hawaiians | 99.7 /100 | #64 | Exceptional 95.0% |
| Turks | 99.7 /100 | #65 | Exceptional 95.0% |
| Immigrants | Australia | 99.7 /100 | #66 | Exceptional 94.9% |
Demographics Similar to Immigrants from India by 10th Grade
In terms of 10th grade, the demographic groups most similar to Immigrants from India are Estonian (95.3%, a difference of 0.010%), Hungarian (95.3%, a difference of 0.020%), French (95.3%, a difference of 0.020%), British (95.3%, a difference of 0.020%), and French Canadian (95.3%, a difference of 0.020%).
| Demographics | Rating | Rank | 10th Grade |
| Bulgarians | 100.0 /100 | #29 | Exceptional 95.4% |
| Belgians | 100.0 /100 | #30 | Exceptional 95.4% |
| Iranians | 100.0 /100 | #31 | Exceptional 95.3% |
| Hungarians | 100.0 /100 | #32 | Exceptional 95.3% |
| French | 100.0 /100 | #33 | Exceptional 95.3% |
| British | 99.9 /100 | #34 | Exceptional 95.3% |
| Estonians | 99.9 /100 | #35 | Exceptional 95.3% |
| Immigrants | India | 99.9 /100 | #36 | Exceptional 95.3% |
| French Canadians | 99.9 /100 | #37 | Exceptional 95.3% |
| Northern Europeans | 99.9 /100 | #38 | Exceptional 95.3% |
| Immigrants | Scotland | 99.9 /100 | #39 | Exceptional 95.2% |
| Scotch-Irish | 99.9 /100 | #40 | Exceptional 95.2% |
| Russians | 99.9 /100 | #41 | Exceptional 95.2% |
| Slavs | 99.9 /100 | #42 | Exceptional 95.2% |
| Macedonians | 99.9 /100 | #43 | Exceptional 95.2% |