Greek vs Immigrants from India 3 or more Vehicles in Household
COMPARE
Greek
Immigrants from India
3 or more Vehicles in Household
3 or more Vehicles in Household Comparison
Greeks
Immigrants from India
20.3%
3 OR MORE VEHICLES IN HOUSEHOLD
88.6/ 100
METRIC RATING
130th/ 347
METRIC RANK
20.2%
3 OR MORE VEHICLES IN HOUSEHOLD
87.2/ 100
METRIC RATING
135th/ 347
METRIC RANK
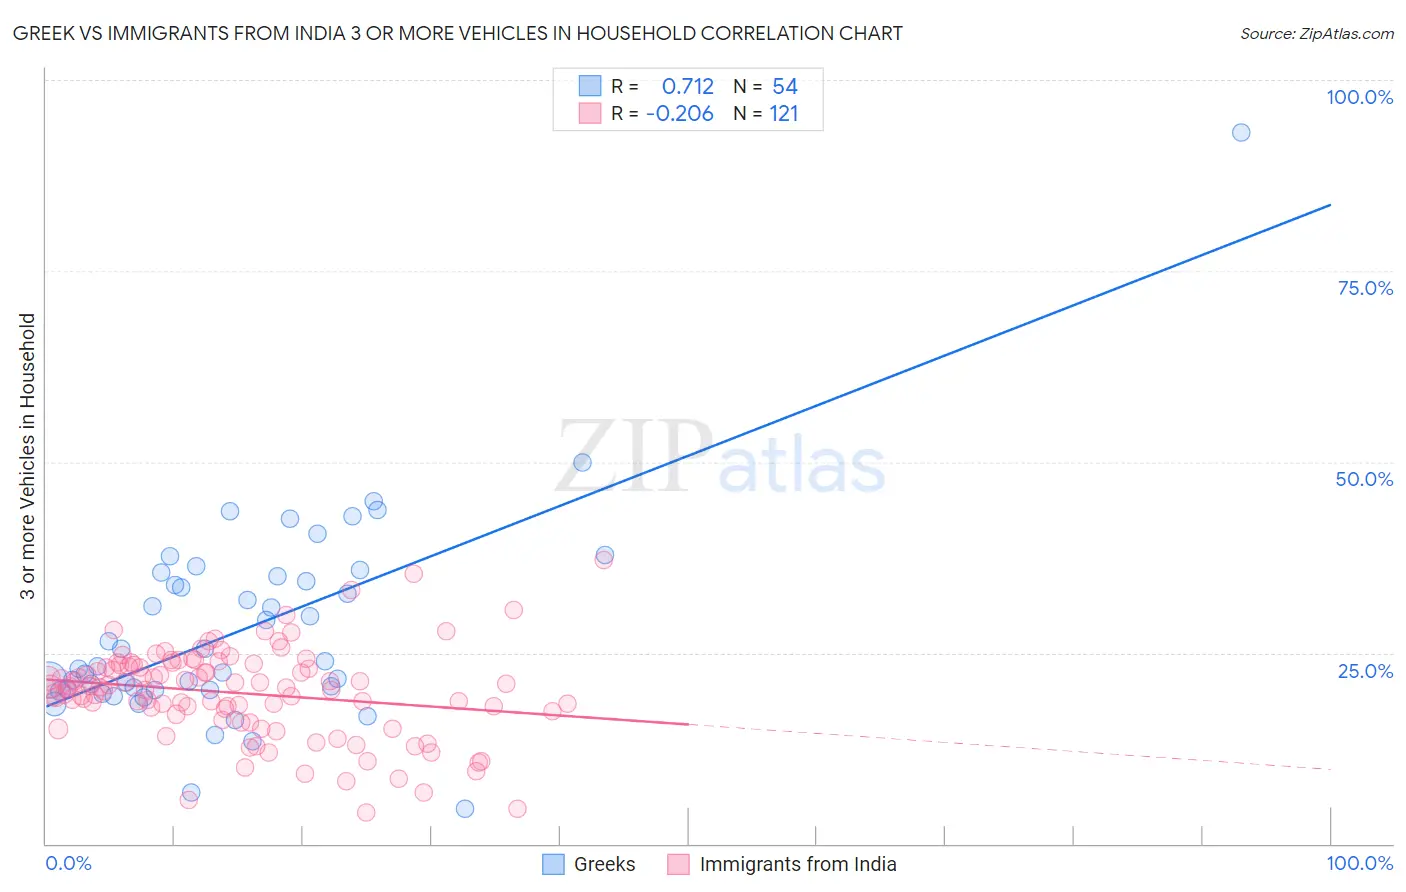
Greek vs Immigrants from India 3 or more Vehicles in Household Correlation Chart
The statistical analysis conducted on geographies consisting of 482,172,821 people shows a strong positive correlation between the proportion of Greeks and percentage of households with 3 or more vehicles available in the United States with a correlation coefficient (R) of 0.712 and weighted average of 20.3%. Similarly, the statistical analysis conducted on geographies consisting of 433,547,679 people shows a weak negative correlation between the proportion of Immigrants from India and percentage of households with 3 or more vehicles available in the United States with a correlation coefficient (R) of -0.206 and weighted average of 20.2%, a difference of 0.24%.
3 or more Vehicles in Household Correlation Summary
| Measurement | Greek | Immigrants from India |
| Minimum | 4.5% | 4.1% |
| Maximum | 93.1% | 37.1% |
| Range | 88.5% | 33.0% |
| Mean | 28.0% | 19.8% |
| Median | 23.6% | 20.5% |
| Interquartile 25% (IQ1) | 20.1% | 17.2% |
| Interquartile 75% (IQ3) | 35.0% | 23.4% |
| Interquartile Range (IQR) | 14.8% | 6.2% |
| Standard Deviation (Sample) | 13.4% | 5.9% |
| Standard Deviation (Population) | 13.3% | 5.9% |
Demographics Similar to Greeks and Immigrants from India by 3 or more Vehicles in Household
In terms of 3 or more vehicles in household, the demographic groups most similar to Greeks are Zimbabwean (20.3%, a difference of 0.030%), Immigrants from Asia (20.2%, a difference of 0.070%), Immigrants from Canada (20.2%, a difference of 0.13%), Immigrants from North America (20.2%, a difference of 0.13%), and Polish (20.2%, a difference of 0.22%). Similarly, the demographic groups most similar to Immigrants from India are Immigrants from Nicaragua (20.2%, a difference of 0.010%), Immigrants from Iraq (20.2%, a difference of 0.010%), Polish (20.2%, a difference of 0.020%), Immigrants from Canada (20.2%, a difference of 0.11%), and Immigrants from North America (20.2%, a difference of 0.11%).
| Demographics | Rating | Rank | 3 or more Vehicles in Household |
| German Russians | 93.7 /100 | #122 | Exceptional 20.5% |
| Immigrants | Korea | 93.7 /100 | #123 | Exceptional 20.5% |
| Central Americans | 93.1 /100 | #124 | Exceptional 20.5% |
| Immigrants | Netherlands | 92.9 /100 | #125 | Exceptional 20.4% |
| Slavs | 92.1 /100 | #126 | Exceptional 20.4% |
| Immigrants | Bolivia | 92.0 /100 | #127 | Exceptional 20.4% |
| New Zealanders | 91.3 /100 | #128 | Exceptional 20.4% |
| Zimbabweans | 88.7 /100 | #129 | Excellent 20.3% |
| Greeks | 88.6 /100 | #130 | Excellent 20.3% |
| Immigrants | Asia | 88.1 /100 | #131 | Excellent 20.2% |
| Immigrants | Canada | 87.8 /100 | #132 | Excellent 20.2% |
| Immigrants | North America | 87.8 /100 | #133 | Excellent 20.2% |
| Poles | 87.3 /100 | #134 | Excellent 20.2% |
| Immigrants | India | 87.2 /100 | #135 | Excellent 20.2% |
| Immigrants | Nicaragua | 87.1 /100 | #136 | Excellent 20.2% |
| Immigrants | Iraq | 87.1 /100 | #137 | Excellent 20.2% |
| Aleuts | 86.3 /100 | #138 | Excellent 20.2% |
| Slovenes | 85.5 /100 | #139 | Excellent 20.2% |
| French American Indians | 85.3 /100 | #140 | Excellent 20.1% |
| Ottawa | 84.9 /100 | #141 | Excellent 20.1% |
| Jordanians | 84.4 /100 | #142 | Excellent 20.1% |