Immigrants from Ecuador vs Immigrants from India 3 or more Vehicles in Household
COMPARE
Immigrants from Ecuador
Immigrants from India
3 or more Vehicles in Household
3 or more Vehicles in Household Comparison
Immigrants from Ecuador
Immigrants from India
13.4%
3 OR MORE VEHICLES IN HOUSEHOLD
0.0/ 100
METRIC RATING
334th/ 347
METRIC RANK
20.2%
3 OR MORE VEHICLES IN HOUSEHOLD
87.2/ 100
METRIC RATING
135th/ 347
METRIC RANK
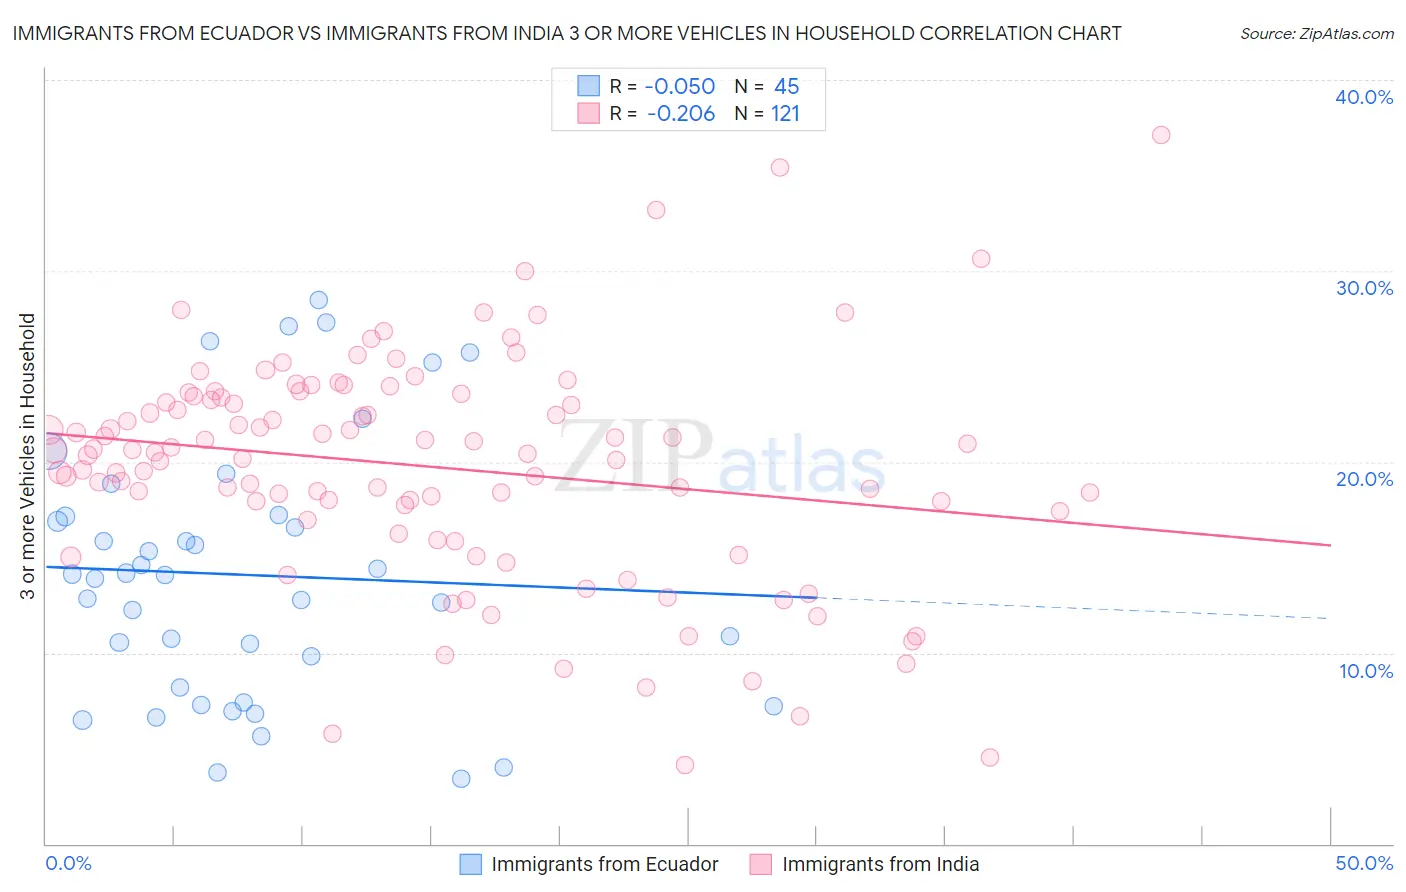
Immigrants from Ecuador vs Immigrants from India 3 or more Vehicles in Household Correlation Chart
The statistical analysis conducted on geographies consisting of 270,830,512 people shows a slight negative correlation between the proportion of Immigrants from Ecuador and percentage of households with 3 or more vehicles available in the United States with a correlation coefficient (R) of -0.050 and weighted average of 13.4%. Similarly, the statistical analysis conducted on geographies consisting of 433,547,679 people shows a weak negative correlation between the proportion of Immigrants from India and percentage of households with 3 or more vehicles available in the United States with a correlation coefficient (R) of -0.206 and weighted average of 20.2%, a difference of 50.8%.
3 or more Vehicles in Household Correlation Summary
| Measurement | Immigrants from Ecuador | Immigrants from India |
| Minimum | 3.4% | 4.1% |
| Maximum | 28.5% | 37.1% |
| Range | 25.0% | 33.0% |
| Mean | 14.1% | 19.8% |
| Median | 14.1% | 20.5% |
| Interquartile 25% (IQ1) | 7.8% | 17.2% |
| Interquartile 75% (IQ3) | 17.2% | 23.4% |
| Interquartile Range (IQR) | 9.4% | 6.2% |
| Standard Deviation (Sample) | 6.8% | 5.9% |
| Standard Deviation (Population) | 6.7% | 5.9% |
Similar Demographics by 3 or more Vehicles in Household
Demographics Similar to Immigrants from Ecuador by 3 or more Vehicles in Household
In terms of 3 or more vehicles in household, the demographic groups most similar to Immigrants from Ecuador are Immigrants from Trinidad and Tobago (13.3%, a difference of 0.46%), Immigrants from Cabo Verde (13.6%, a difference of 1.3%), Trinidadian and Tobagonian (13.6%, a difference of 1.6%), Immigrants from Dominica (13.7%, a difference of 2.4%), and West Indian (13.7%, a difference of 2.6%).
| Demographics | Rating | Rank | 3 or more Vehicles in Household |
| Ecuadorians | 0.0 /100 | #327 | Tragic 14.1% |
| Immigrants | Albania | 0.0 /100 | #328 | Tragic 14.0% |
| Immigrants | Senegal | 0.0 /100 | #329 | Tragic 13.8% |
| West Indians | 0.0 /100 | #330 | Tragic 13.7% |
| Immigrants | Dominica | 0.0 /100 | #331 | Tragic 13.7% |
| Trinidadians and Tobagonians | 0.0 /100 | #332 | Tragic 13.6% |
| Immigrants | Cabo Verde | 0.0 /100 | #333 | Tragic 13.6% |
| Immigrants | Ecuador | 0.0 /100 | #334 | Tragic 13.4% |
| Immigrants | Trinidad and Tobago | 0.0 /100 | #335 | Tragic 13.3% |
| Barbadians | 0.0 /100 | #336 | Tragic 12.6% |
| Immigrants | Bangladesh | 0.0 /100 | #337 | Tragic 12.5% |
| Vietnamese | 0.0 /100 | #338 | Tragic 12.5% |
| Immigrants | Uzbekistan | 0.0 /100 | #339 | Tragic 12.0% |
| Immigrants | Barbados | 0.0 /100 | #340 | Tragic 11.7% |
| Guyanese | 0.0 /100 | #341 | Tragic 11.5% |
Demographics Similar to Immigrants from India by 3 or more Vehicles in Household
In terms of 3 or more vehicles in household, the demographic groups most similar to Immigrants from India are Immigrants from Nicaragua (20.2%, a difference of 0.010%), Immigrants from Iraq (20.2%, a difference of 0.010%), Polish (20.2%, a difference of 0.020%), Immigrants from Canada (20.2%, a difference of 0.11%), and Immigrants from North America (20.2%, a difference of 0.11%).
| Demographics | Rating | Rank | 3 or more Vehicles in Household |
| New Zealanders | 91.3 /100 | #128 | Exceptional 20.4% |
| Zimbabweans | 88.7 /100 | #129 | Excellent 20.3% |
| Greeks | 88.6 /100 | #130 | Excellent 20.3% |
| Immigrants | Asia | 88.1 /100 | #131 | Excellent 20.2% |
| Immigrants | Canada | 87.8 /100 | #132 | Excellent 20.2% |
| Immigrants | North America | 87.8 /100 | #133 | Excellent 20.2% |
| Poles | 87.3 /100 | #134 | Excellent 20.2% |
| Immigrants | India | 87.2 /100 | #135 | Excellent 20.2% |
| Immigrants | Nicaragua | 87.1 /100 | #136 | Excellent 20.2% |
| Immigrants | Iraq | 87.1 /100 | #137 | Excellent 20.2% |
| Aleuts | 86.3 /100 | #138 | Excellent 20.2% |
| Slovenes | 85.5 /100 | #139 | Excellent 20.2% |
| French American Indians | 85.3 /100 | #140 | Excellent 20.1% |
| Ottawa | 84.9 /100 | #141 | Excellent 20.1% |
| Jordanians | 84.4 /100 | #142 | Excellent 20.1% |