Cape Verdean vs Maltese 3 or more Vehicles in Household
COMPARE
Cape Verdean
Maltese
3 or more Vehicles in Household
3 or more Vehicles in Household Comparison
Cape Verdeans
Maltese
15.0%
3 OR MORE VEHICLES IN HOUSEHOLD
0.0/ 100
METRIC RATING
319th/ 347
METRIC RANK
20.5%
3 OR MORE VEHICLES IN HOUSEHOLD
93.9/ 100
METRIC RATING
120th/ 347
METRIC RANK
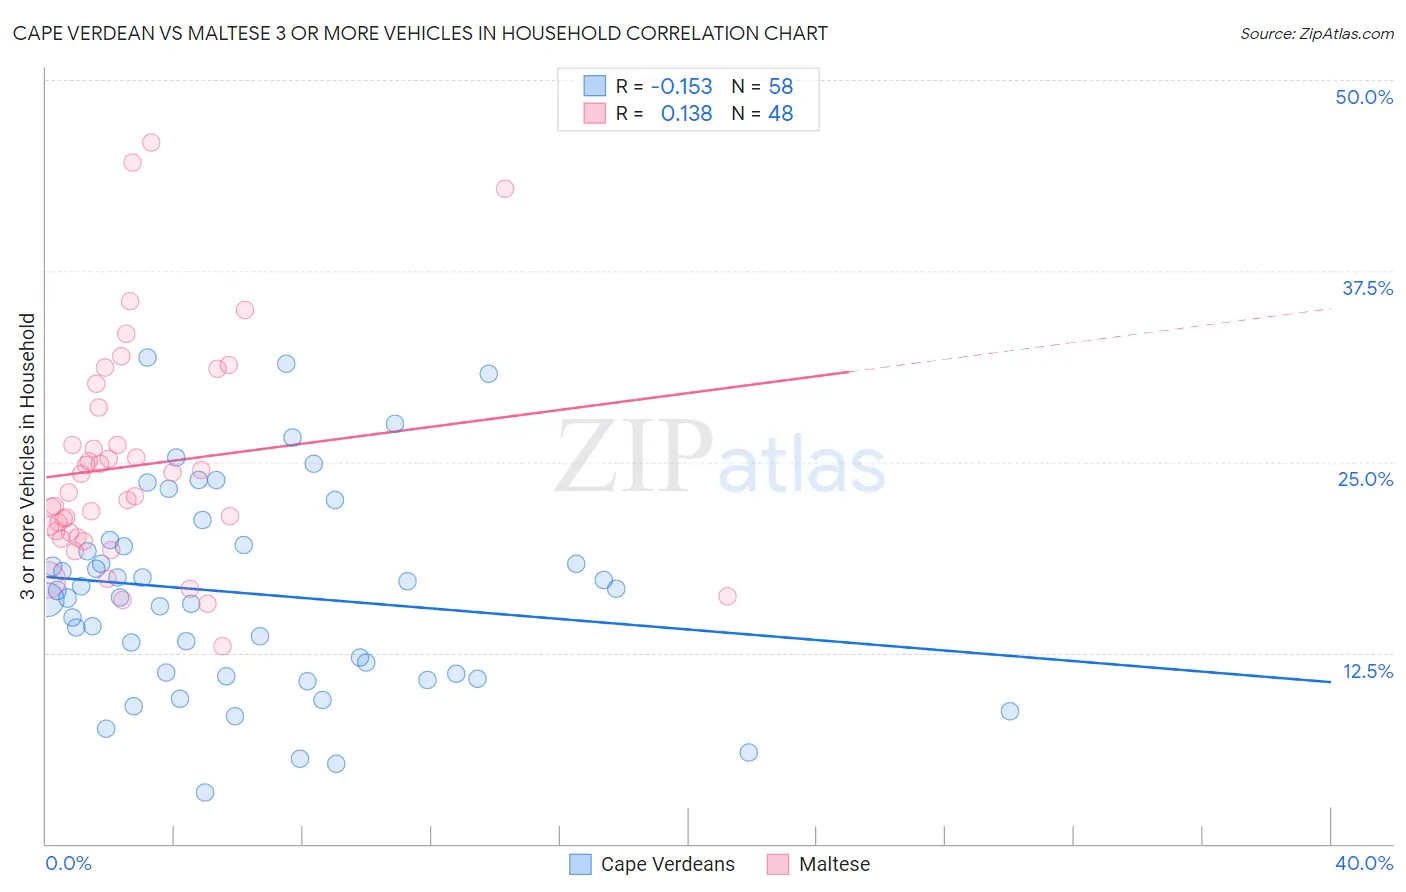
Cape Verdean vs Maltese 3 or more Vehicles in Household Correlation Chart
The statistical analysis conducted on geographies consisting of 107,543,887 people shows a poor negative correlation between the proportion of Cape Verdeans and percentage of households with 3 or more vehicles available in the United States with a correlation coefficient (R) of -0.153 and weighted average of 15.0%. Similarly, the statistical analysis conducted on geographies consisting of 126,427,013 people shows a poor positive correlation between the proportion of Maltese and percentage of households with 3 or more vehicles available in the United States with a correlation coefficient (R) of 0.138 and weighted average of 20.5%, a difference of 36.7%.
3 or more Vehicles in Household Correlation Summary
| Measurement | Cape Verdean | Maltese |
| Minimum | 3.3% | 12.9% |
| Maximum | 31.8% | 45.9% |
| Range | 28.5% | 33.0% |
| Mean | 16.4% | 24.8% |
| Median | 16.3% | 22.8% |
| Interquartile 25% (IQ1) | 11.2% | 20.2% |
| Interquartile 75% (IQ3) | 19.5% | 27.4% |
| Interquartile Range (IQR) | 8.4% | 7.1% |
| Standard Deviation (Sample) | 6.6% | 7.3% |
| Standard Deviation (Population) | 6.6% | 7.2% |
Similar Demographics by 3 or more Vehicles in Household
Demographics Similar to Cape Verdeans by 3 or more Vehicles in Household
In terms of 3 or more vehicles in household, the demographic groups most similar to Cape Verdeans are Yup'ik (14.8%, a difference of 1.1%), Immigrants from Haiti (15.2%, a difference of 1.2%), Jamaican (15.2%, a difference of 1.4%), Immigrants from Jamaica (14.7%, a difference of 2.2%), and Immigrants from West Indies (14.6%, a difference of 2.5%).
| Demographics | Rating | Rank | 3 or more Vehicles in Household |
| Puerto Ricans | 0.0 /100 | #312 | Tragic 15.6% |
| Immigrants | Israel | 0.0 /100 | #313 | Tragic 15.6% |
| Immigrants | Belarus | 0.0 /100 | #314 | Tragic 15.5% |
| Haitians | 0.0 /100 | #315 | Tragic 15.5% |
| U.S. Virgin Islanders | 0.0 /100 | #316 | Tragic 15.4% |
| Jamaicans | 0.0 /100 | #317 | Tragic 15.2% |
| Immigrants | Haiti | 0.0 /100 | #318 | Tragic 15.2% |
| Cape Verdeans | 0.0 /100 | #319 | Tragic 15.0% |
| Yup'ik | 0.0 /100 | #320 | Tragic 14.8% |
| Immigrants | Jamaica | 0.0 /100 | #321 | Tragic 14.7% |
| Immigrants | West Indies | 0.0 /100 | #322 | Tragic 14.6% |
| Immigrants | Caribbean | 0.0 /100 | #323 | Tragic 14.6% |
| Immigrants | Yemen | 0.0 /100 | #324 | Tragic 14.2% |
| Senegalese | 0.0 /100 | #325 | Tragic 14.2% |
| Soviet Union | 0.0 /100 | #326 | Tragic 14.2% |
Demographics Similar to Maltese by 3 or more Vehicles in Household
In terms of 3 or more vehicles in household, the demographic groups most similar to Maltese are Immigrants from Thailand (20.5%, a difference of 0.010%), German Russian (20.5%, a difference of 0.060%), Immigrants from Korea (20.5%, a difference of 0.060%), Immigrants from Latin America (20.5%, a difference of 0.19%), and Costa Rican (20.6%, a difference of 0.23%).
| Demographics | Rating | Rank | 3 or more Vehicles in Household |
| Immigrants | England | 96.2 /100 | #113 | Exceptional 20.7% |
| Burmese | 95.8 /100 | #114 | Exceptional 20.6% |
| French Canadians | 95.0 /100 | #115 | Exceptional 20.6% |
| Italians | 94.9 /100 | #116 | Exceptional 20.6% |
| Croatians | 94.9 /100 | #117 | Exceptional 20.6% |
| Costa Ricans | 94.6 /100 | #118 | Exceptional 20.6% |
| Immigrants | Latin America | 94.5 /100 | #119 | Exceptional 20.5% |
| Maltese | 93.9 /100 | #120 | Exceptional 20.5% |
| Immigrants | Thailand | 93.8 /100 | #121 | Exceptional 20.5% |
| German Russians | 93.7 /100 | #122 | Exceptional 20.5% |
| Immigrants | Korea | 93.7 /100 | #123 | Exceptional 20.5% |
| Central Americans | 93.1 /100 | #124 | Exceptional 20.5% |
| Immigrants | Netherlands | 92.9 /100 | #125 | Exceptional 20.4% |
| Slavs | 92.1 /100 | #126 | Exceptional 20.4% |
| Immigrants | Bolivia | 92.0 /100 | #127 | Exceptional 20.4% |