Cape Verdean vs Marshallese 3 or more Vehicles in Household
COMPARE
Cape Verdean
Marshallese
3 or more Vehicles in Household
3 or more Vehicles in Household Comparison
Cape Verdeans
Marshallese
15.0%
3 OR MORE VEHICLES IN HOUSEHOLD
0.0/ 100
METRIC RATING
319th/ 347
METRIC RANK
21.3%
3 OR MORE VEHICLES IN HOUSEHOLD
99.2/ 100
METRIC RATING
89th/ 347
METRIC RANK
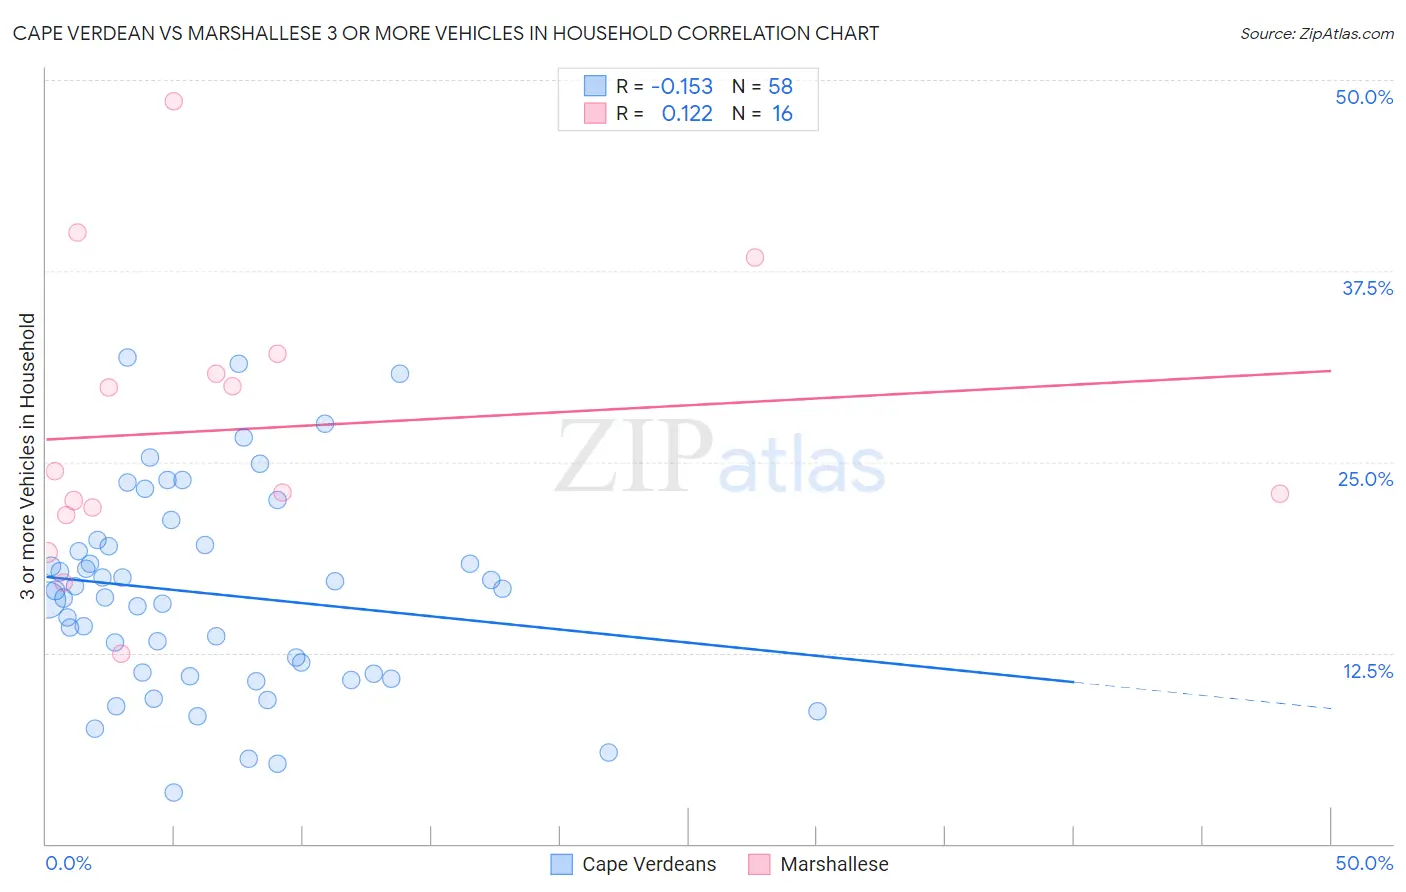
Cape Verdean vs Marshallese 3 or more Vehicles in Household Correlation Chart
The statistical analysis conducted on geographies consisting of 107,543,887 people shows a poor negative correlation between the proportion of Cape Verdeans and percentage of households with 3 or more vehicles available in the United States with a correlation coefficient (R) of -0.153 and weighted average of 15.0%. Similarly, the statistical analysis conducted on geographies consisting of 14,761,315 people shows a poor positive correlation between the proportion of Marshallese and percentage of households with 3 or more vehicles available in the United States with a correlation coefficient (R) of 0.122 and weighted average of 21.3%, a difference of 42.0%.
3 or more Vehicles in Household Correlation Summary
| Measurement | Cape Verdean | Marshallese |
| Minimum | 3.3% | 12.4% |
| Maximum | 31.8% | 48.6% |
| Range | 28.5% | 36.2% |
| Mean | 16.4% | 27.2% |
| Median | 16.3% | 23.7% |
| Interquartile 25% (IQ1) | 11.2% | 21.8% |
| Interquartile 75% (IQ3) | 19.5% | 31.4% |
| Interquartile Range (IQR) | 8.4% | 9.6% |
| Standard Deviation (Sample) | 6.6% | 9.3% |
| Standard Deviation (Population) | 6.6% | 9.0% |
Similar Demographics by 3 or more Vehicles in Household
Demographics Similar to Cape Verdeans by 3 or more Vehicles in Household
In terms of 3 or more vehicles in household, the demographic groups most similar to Cape Verdeans are Yup'ik (14.8%, a difference of 1.1%), Immigrants from Haiti (15.2%, a difference of 1.2%), Jamaican (15.2%, a difference of 1.4%), Immigrants from Jamaica (14.7%, a difference of 2.2%), and Immigrants from West Indies (14.6%, a difference of 2.5%).
| Demographics | Rating | Rank | 3 or more Vehicles in Household |
| Puerto Ricans | 0.0 /100 | #312 | Tragic 15.6% |
| Immigrants | Israel | 0.0 /100 | #313 | Tragic 15.6% |
| Immigrants | Belarus | 0.0 /100 | #314 | Tragic 15.5% |
| Haitians | 0.0 /100 | #315 | Tragic 15.5% |
| U.S. Virgin Islanders | 0.0 /100 | #316 | Tragic 15.4% |
| Jamaicans | 0.0 /100 | #317 | Tragic 15.2% |
| Immigrants | Haiti | 0.0 /100 | #318 | Tragic 15.2% |
| Cape Verdeans | 0.0 /100 | #319 | Tragic 15.0% |
| Yup'ik | 0.0 /100 | #320 | Tragic 14.8% |
| Immigrants | Jamaica | 0.0 /100 | #321 | Tragic 14.7% |
| Immigrants | West Indies | 0.0 /100 | #322 | Tragic 14.6% |
| Immigrants | Caribbean | 0.0 /100 | #323 | Tragic 14.6% |
| Immigrants | Yemen | 0.0 /100 | #324 | Tragic 14.2% |
| Senegalese | 0.0 /100 | #325 | Tragic 14.2% |
| Soviet Union | 0.0 /100 | #326 | Tragic 14.2% |
Demographics Similar to Marshallese by 3 or more Vehicles in Household
In terms of 3 or more vehicles in household, the demographic groups most similar to Marshallese are Immigrants from Afghanistan (21.2%, a difference of 0.22%), Belgian (21.2%, a difference of 0.55%), French (21.4%, a difference of 0.56%), Apache (21.2%, a difference of 0.63%), and Immigrants from the Azores (21.5%, a difference of 0.82%).
| Demographics | Rating | Rank | 3 or more Vehicles in Household |
| Immigrants | El Salvador | 99.6 /100 | #82 | Exceptional 21.5% |
| Chippewa | 99.6 /100 | #83 | Exceptional 21.5% |
| Icelanders | 99.6 /100 | #84 | Exceptional 21.5% |
| Laotians | 99.6 /100 | #85 | Exceptional 21.5% |
| Delaware | 99.6 /100 | #86 | Exceptional 21.5% |
| Immigrants | Azores | 99.5 /100 | #87 | Exceptional 21.5% |
| French | 99.4 /100 | #88 | Exceptional 21.4% |
| Marshallese | 99.2 /100 | #89 | Exceptional 21.3% |
| Immigrants | Afghanistan | 99.1 /100 | #90 | Exceptional 21.2% |
| Belgians | 98.9 /100 | #91 | Exceptional 21.2% |
| Apache | 98.9 /100 | #92 | Exceptional 21.2% |
| Immigrants | Indonesia | 98.8 /100 | #93 | Exceptional 21.1% |
| Immigrants | Cambodia | 98.6 /100 | #94 | Exceptional 21.1% |
| Pakistanis | 98.5 /100 | #95 | Exceptional 21.0% |
| Cree | 98.4 /100 | #96 | Exceptional 21.0% |