Cape Verdean vs Immigrants from Moldova In Labor Force | Age 20-24
COMPARE
Cape Verdean
Immigrants from Moldova
In Labor Force | Age 20-24
In Labor Force | Age 20-24 Comparison
Cape Verdeans
Immigrants from Moldova
78.3%
IN LABOR FORCE | AGE 20-24
100.0/ 100
METRIC RATING
17th/ 347
METRIC RANK
76.6%
IN LABOR FORCE | AGE 20-24
99.6/ 100
METRIC RATING
76th/ 347
METRIC RANK
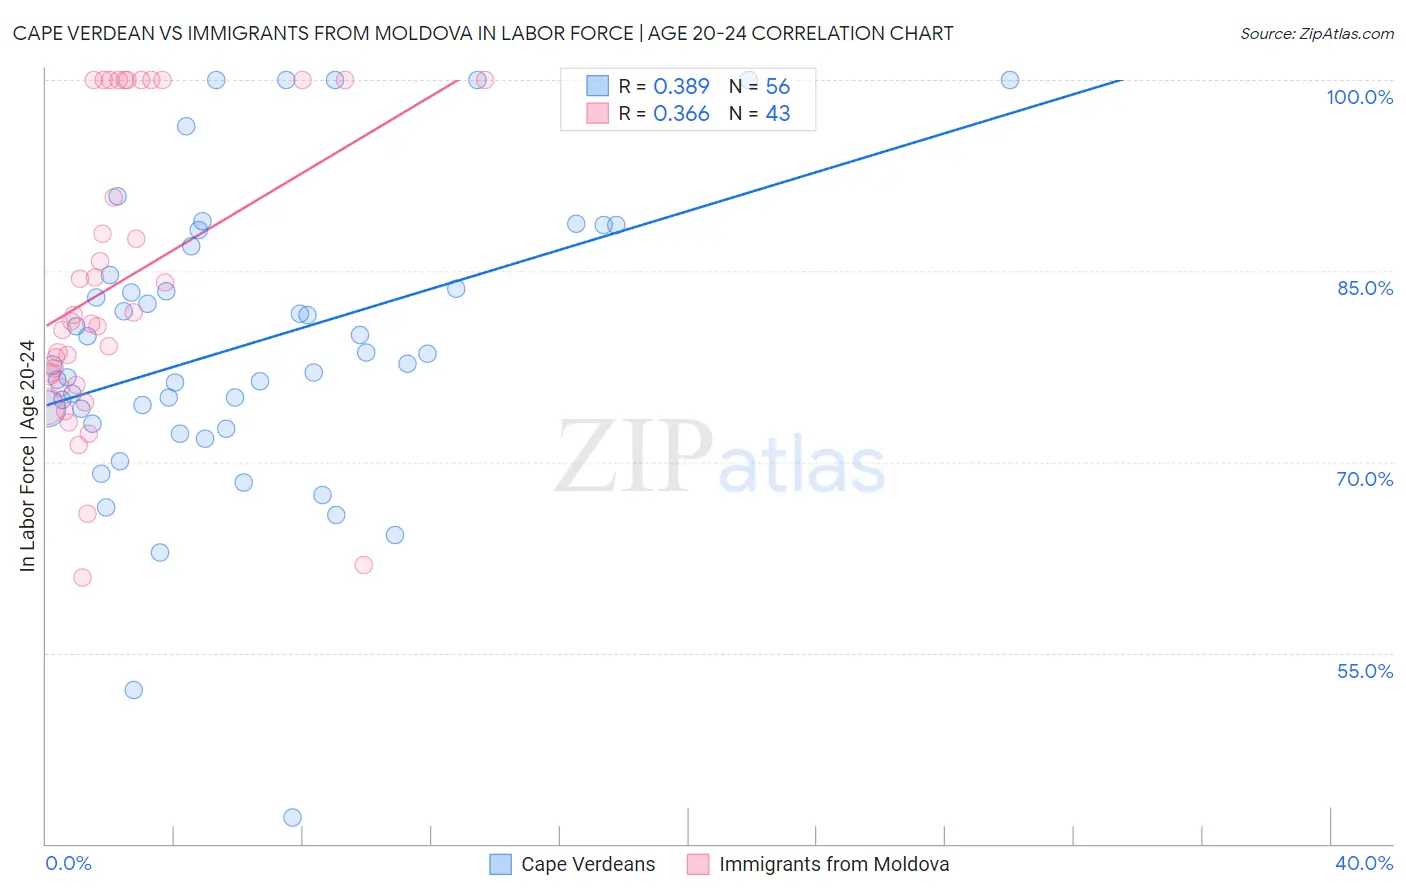
Cape Verdean vs Immigrants from Moldova In Labor Force | Age 20-24 Correlation Chart
The statistical analysis conducted on geographies consisting of 107,566,363 people shows a mild positive correlation between the proportion of Cape Verdeans and labor force participation rate among population between the ages 20 and 24 in the United States with a correlation coefficient (R) of 0.389 and weighted average of 78.3%. Similarly, the statistical analysis conducted on geographies consisting of 124,381,237 people shows a mild positive correlation between the proportion of Immigrants from Moldova and labor force participation rate among population between the ages 20 and 24 in the United States with a correlation coefficient (R) of 0.366 and weighted average of 76.6%, a difference of 2.3%.
In Labor Force | Age 20-24 Correlation Summary
| Measurement | Cape Verdean | Immigrants from Moldova |
| Minimum | 42.1% | 60.9% |
| Maximum | 100.0% | 100.0% |
| Range | 57.9% | 39.1% |
| Mean | 79.3% | 84.1% |
| Median | 78.1% | 81.0% |
| Interquartile 25% (IQ1) | 73.6% | 76.0% |
| Interquartile 75% (IQ3) | 85.8% | 100.0% |
| Interquartile Range (IQR) | 12.2% | 24.0% |
| Standard Deviation (Sample) | 11.6% | 11.6% |
| Standard Deviation (Population) | 11.5% | 11.5% |
Similar Demographics by In Labor Force | Age 20-24
Demographics Similar to Cape Verdeans by In Labor Force | Age 20-24
In terms of in labor force | age 20-24, the demographic groups most similar to Cape Verdeans are Dutch (78.4%, a difference of 0.040%), Sudanese (78.4%, a difference of 0.090%), Czech (78.5%, a difference of 0.22%), Scandinavian (78.5%, a difference of 0.23%), and German (78.6%, a difference of 0.30%).
| Demographics | Rating | Rank | In Labor Force | Age 20-24 |
| Slovenes | 100.0 /100 | #10 | Exceptional 78.7% |
| Finns | 100.0 /100 | #11 | Exceptional 78.7% |
| Germans | 100.0 /100 | #12 | Exceptional 78.6% |
| Scandinavians | 100.0 /100 | #13 | Exceptional 78.5% |
| Czechs | 100.0 /100 | #14 | Exceptional 78.5% |
| Sudanese | 100.0 /100 | #15 | Exceptional 78.4% |
| Dutch | 100.0 /100 | #16 | Exceptional 78.4% |
| Cape Verdeans | 100.0 /100 | #17 | Exceptional 78.3% |
| Immigrants | Bosnia and Herzegovina | 100.0 /100 | #18 | Exceptional 78.1% |
| Bangladeshis | 100.0 /100 | #19 | Exceptional 78.1% |
| French Canadians | 100.0 /100 | #20 | Exceptional 78.1% |
| Puget Sound Salish | 100.0 /100 | #21 | Exceptional 78.0% |
| Pennsylvania Germans | 100.0 /100 | #22 | Exceptional 78.0% |
| Yugoslavians | 100.0 /100 | #23 | Exceptional 78.0% |
| Liberians | 100.0 /100 | #24 | Exceptional 78.0% |
Demographics Similar to Immigrants from Moldova by In Labor Force | Age 20-24
In terms of in labor force | age 20-24, the demographic groups most similar to Immigrants from Moldova are Immigrants from Cameroon (76.6%, a difference of 0.030%), Immigrants from Middle Africa (76.6%, a difference of 0.040%), Canadian (76.6%, a difference of 0.040%), Cree (76.6%, a difference of 0.060%), and Immigrants from Zaire (76.6%, a difference of 0.060%).
| Demographics | Rating | Rank | In Labor Force | Age 20-24 |
| Immigrants | Sudan | 99.8 /100 | #69 | Exceptional 76.8% |
| Ottawa | 99.8 /100 | #70 | Exceptional 76.8% |
| Northern Europeans | 99.8 /100 | #71 | Exceptional 76.8% |
| Guamanians/Chamorros | 99.8 /100 | #72 | Exceptional 76.7% |
| British | 99.8 /100 | #73 | Exceptional 76.7% |
| Cree | 99.7 /100 | #74 | Exceptional 76.6% |
| Immigrants | Middle Africa | 99.7 /100 | #75 | Exceptional 76.6% |
| Immigrants | Moldova | 99.6 /100 | #76 | Exceptional 76.6% |
| Immigrants | Cameroon | 99.6 /100 | #77 | Exceptional 76.6% |
| Canadians | 99.6 /100 | #78 | Exceptional 76.6% |
| Immigrants | Zaire | 99.6 /100 | #79 | Exceptional 76.6% |
| Italians | 99.6 /100 | #80 | Exceptional 76.5% |
| Basques | 99.5 /100 | #81 | Exceptional 76.5% |
| Hmong | 99.5 /100 | #82 | Exceptional 76.5% |
| Carpatho Rusyns | 99.4 /100 | #83 | Exceptional 76.5% |