Austrian vs Immigrants from Romania 3 or more Vehicles in Household
COMPARE
Austrian
Immigrants from Romania
3 or more Vehicles in Household
3 or more Vehicles in Household Comparison
Austrians
Immigrants from Romania
20.9%
3 OR MORE VEHICLES IN HOUSEHOLD
97.5/ 100
METRIC RATING
105th/ 347
METRIC RANK
18.9%
3 OR MORE VEHICLES IN HOUSEHOLD
14.6/ 100
METRIC RATING
204th/ 347
METRIC RANK
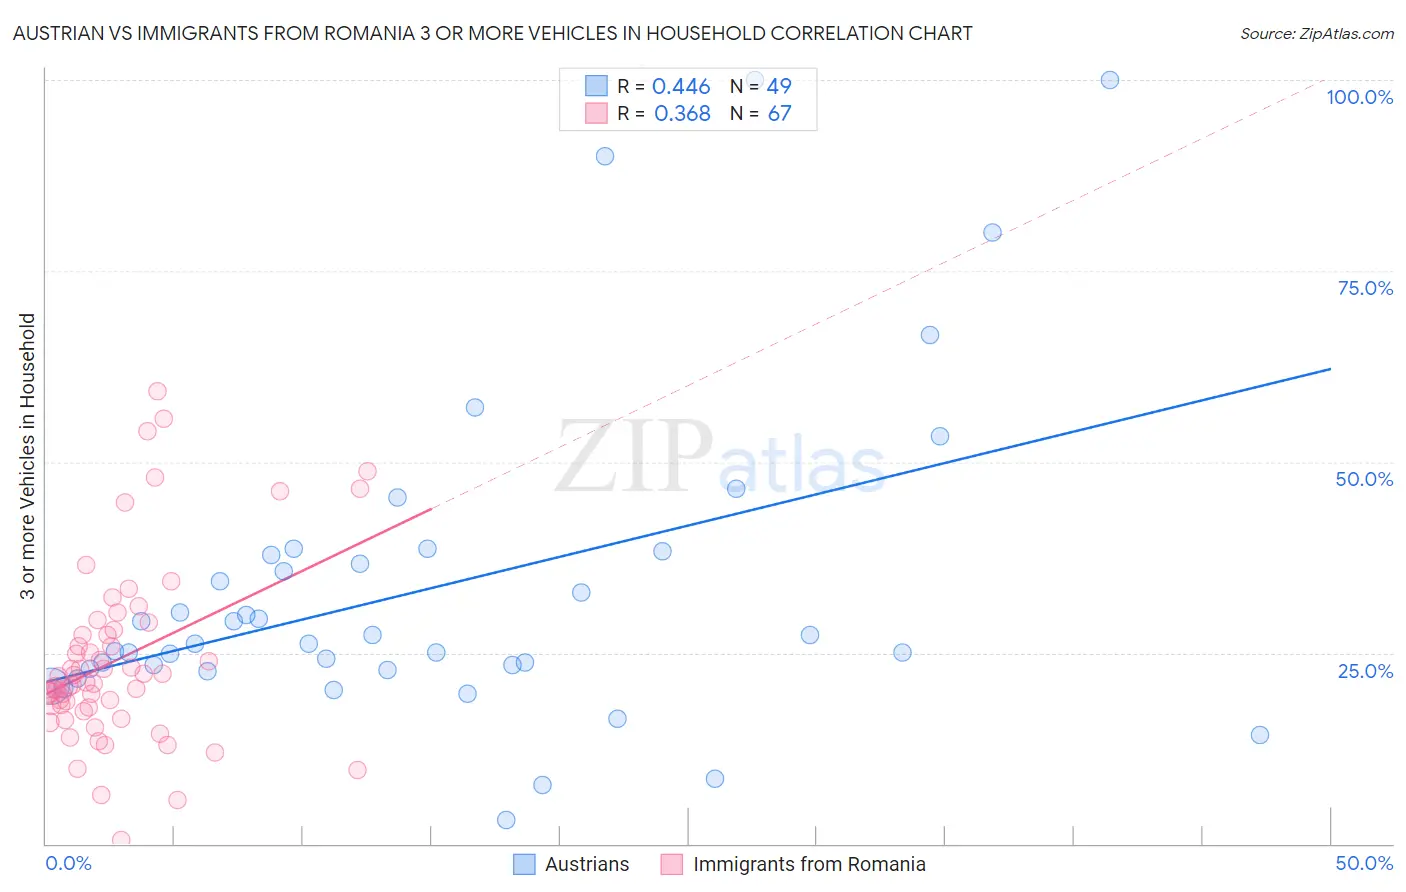
Austrian vs Immigrants from Romania 3 or more Vehicles in Household Correlation Chart
The statistical analysis conducted on geographies consisting of 451,648,303 people shows a moderate positive correlation between the proportion of Austrians and percentage of households with 3 or more vehicles available in the United States with a correlation coefficient (R) of 0.446 and weighted average of 20.9%. Similarly, the statistical analysis conducted on geographies consisting of 256,899,833 people shows a mild positive correlation between the proportion of Immigrants from Romania and percentage of households with 3 or more vehicles available in the United States with a correlation coefficient (R) of 0.368 and weighted average of 18.9%, a difference of 10.6%.
3 or more Vehicles in Household Correlation Summary
| Measurement | Austrian | Immigrants from Romania |
| Minimum | 3.1% | 0.43% |
| Maximum | 100.0% | 59.2% |
| Range | 96.9% | 58.8% |
| Mean | 33.7% | 24.2% |
| Median | 26.2% | 21.0% |
| Interquartile 25% (IQ1) | 22.8% | 17.8% |
| Interquartile 75% (IQ3) | 38.0% | 28.0% |
| Interquartile Range (IQR) | 15.2% | 10.2% |
| Standard Deviation (Sample) | 21.3% | 11.9% |
| Standard Deviation (Population) | 21.1% | 11.8% |
Similar Demographics by 3 or more Vehicles in Household
Demographics Similar to Austrians by 3 or more Vehicles in Household
In terms of 3 or more vehicles in household, the demographic groups most similar to Austrians are Bolivian (20.8%, a difference of 0.090%), Luxembourger (20.9%, a difference of 0.10%), Immigrants from Germany (20.8%, a difference of 0.13%), Dutch West Indian (20.9%, a difference of 0.19%), and Seminole (20.9%, a difference of 0.23%).
| Demographics | Rating | Rank | 3 or more Vehicles in Household |
| Hmong | 98.2 /100 | #98 | Exceptional 21.0% |
| Alaska Natives | 98.2 /100 | #99 | Exceptional 21.0% |
| Comanche | 98.2 /100 | #100 | Exceptional 21.0% |
| Blackfeet | 97.9 /100 | #101 | Exceptional 20.9% |
| Seminole | 97.8 /100 | #102 | Exceptional 20.9% |
| Dutch West Indians | 97.8 /100 | #103 | Exceptional 20.9% |
| Luxembourgers | 97.7 /100 | #104 | Exceptional 20.9% |
| Austrians | 97.5 /100 | #105 | Exceptional 20.9% |
| Bolivians | 97.4 /100 | #106 | Exceptional 20.8% |
| Immigrants | Germany | 97.4 /100 | #107 | Exceptional 20.8% |
| Immigrants | Scotland | 97.1 /100 | #108 | Exceptional 20.8% |
| Filipinos | 97.0 /100 | #109 | Exceptional 20.8% |
| Asians | 96.8 /100 | #110 | Exceptional 20.8% |
| Immigrants | Micronesia | 96.7 /100 | #111 | Exceptional 20.7% |
| Nicaraguans | 96.2 /100 | #112 | Exceptional 20.7% |
Demographics Similar to Immigrants from Romania by 3 or more Vehicles in Household
In terms of 3 or more vehicles in household, the demographic groups most similar to Immigrants from Romania are Tohono O'odham (18.9%, a difference of 0.030%), Russian (18.8%, a difference of 0.070%), Immigrants from Eastern Asia (18.8%, a difference of 0.080%), Immigrants from Austria (18.9%, a difference of 0.12%), and Immigrants from Chile (18.8%, a difference of 0.16%).
| Demographics | Rating | Rank | 3 or more Vehicles in Household |
| Immigrants | Japan | 22.0 /100 | #197 | Fair 19.0% |
| Egyptians | 19.5 /100 | #198 | Poor 19.0% |
| Immigrants | Norway | 19.0 /100 | #199 | Poor 19.0% |
| Argentineans | 18.2 /100 | #200 | Poor 18.9% |
| Arabs | 17.7 /100 | #201 | Poor 18.9% |
| Immigrants | Austria | 15.4 /100 | #202 | Poor 18.9% |
| Tohono O'odham | 14.8 /100 | #203 | Poor 18.9% |
| Immigrants | Romania | 14.6 /100 | #204 | Poor 18.9% |
| Russians | 14.2 /100 | #205 | Poor 18.8% |
| Immigrants | Eastern Asia | 14.1 /100 | #206 | Poor 18.8% |
| Immigrants | Chile | 13.6 /100 | #207 | Poor 18.8% |
| Immigrants | Burma/Myanmar | 13.6 /100 | #208 | Poor 18.8% |
| Immigrants | Egypt | 13.5 /100 | #209 | Poor 18.8% |
| Bulgarians | 13.1 /100 | #210 | Poor 18.8% |
| Immigrants | Kenya | 12.4 /100 | #211 | Poor 18.8% |