Immigrants from Albania vs Immigrants from Romania 3 or more Vehicles in Household
COMPARE
Immigrants from Albania
Immigrants from Romania
3 or more Vehicles in Household
3 or more Vehicles in Household Comparison
Immigrants from Albania
Immigrants from Romania
14.0%
3 OR MORE VEHICLES IN HOUSEHOLD
0.0/ 100
METRIC RATING
328th/ 347
METRIC RANK
18.9%
3 OR MORE VEHICLES IN HOUSEHOLD
14.6/ 100
METRIC RATING
204th/ 347
METRIC RANK
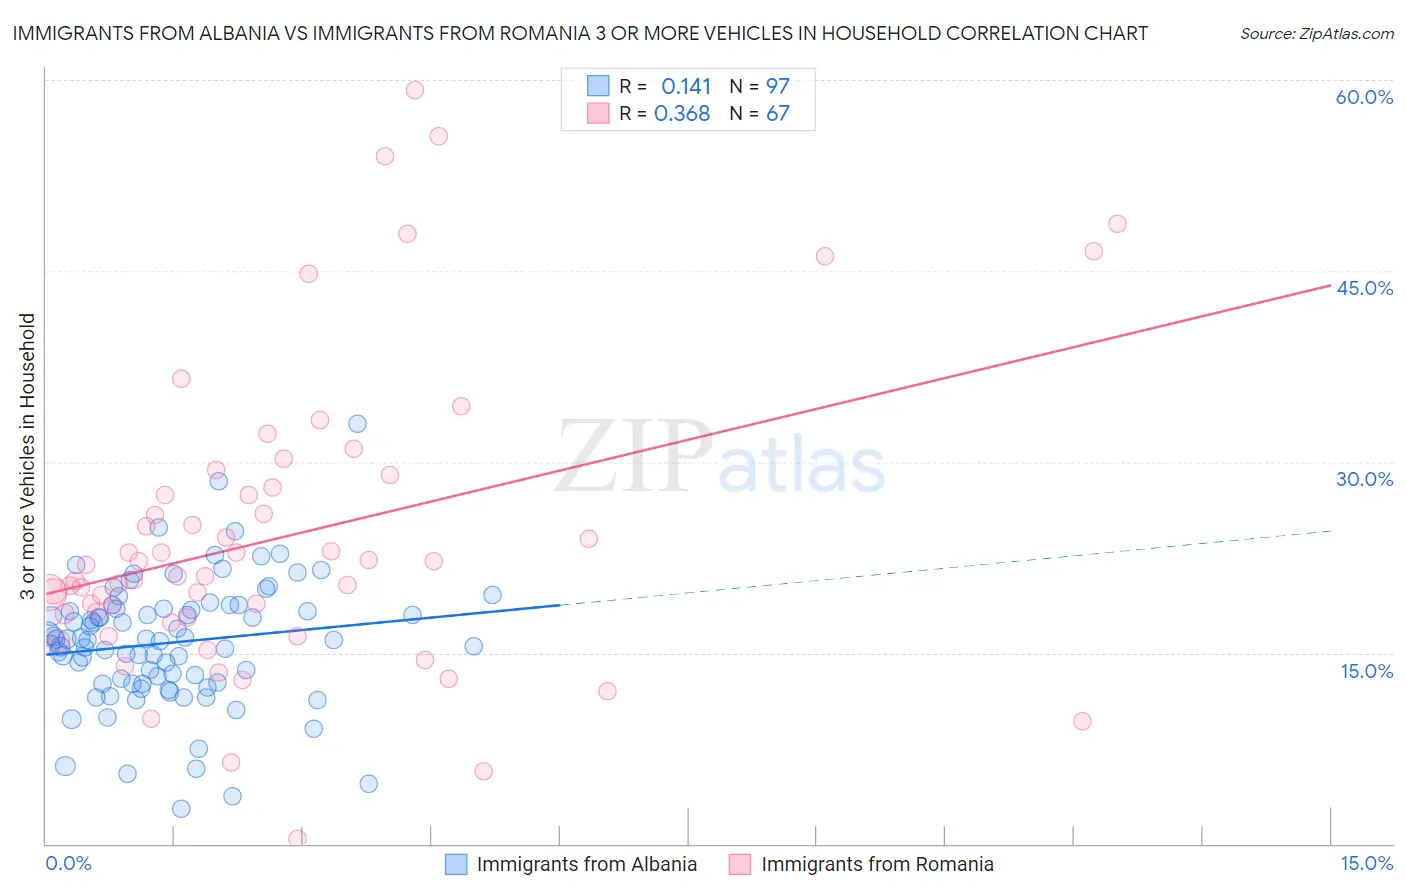
Immigrants from Albania vs Immigrants from Romania 3 or more Vehicles in Household Correlation Chart
The statistical analysis conducted on geographies consisting of 119,328,731 people shows a poor positive correlation between the proportion of Immigrants from Albania and percentage of households with 3 or more vehicles available in the United States with a correlation coefficient (R) of 0.141 and weighted average of 14.0%. Similarly, the statistical analysis conducted on geographies consisting of 256,899,833 people shows a mild positive correlation between the proportion of Immigrants from Romania and percentage of households with 3 or more vehicles available in the United States with a correlation coefficient (R) of 0.368 and weighted average of 18.9%, a difference of 35.1%.
3 or more Vehicles in Household Correlation Summary
| Measurement | Immigrants from Albania | Immigrants from Romania |
| Minimum | 2.7% | 0.43% |
| Maximum | 33.0% | 59.2% |
| Range | 30.3% | 58.8% |
| Mean | 15.8% | 24.2% |
| Median | 16.1% | 21.0% |
| Interquartile 25% (IQ1) | 12.6% | 17.8% |
| Interquartile 75% (IQ3) | 18.4% | 28.0% |
| Interquartile Range (IQR) | 5.8% | 10.2% |
| Standard Deviation (Sample) | 5.0% | 11.9% |
| Standard Deviation (Population) | 5.0% | 11.8% |
Similar Demographics by 3 or more Vehicles in Household
Demographics Similar to Immigrants from Albania by 3 or more Vehicles in Household
In terms of 3 or more vehicles in household, the demographic groups most similar to Immigrants from Albania are Ecuadorian (14.1%, a difference of 0.71%), Immigrants from Senegal (13.8%, a difference of 1.2%), West Indian (13.7%, a difference of 1.5%), Soviet Union (14.2%, a difference of 1.6%), and Immigrants from Dominica (13.7%, a difference of 1.7%).
| Demographics | Rating | Rank | 3 or more Vehicles in Household |
| Immigrants | Jamaica | 0.0 /100 | #321 | Tragic 14.7% |
| Immigrants | West Indies | 0.0 /100 | #322 | Tragic 14.6% |
| Immigrants | Caribbean | 0.0 /100 | #323 | Tragic 14.6% |
| Immigrants | Yemen | 0.0 /100 | #324 | Tragic 14.2% |
| Senegalese | 0.0 /100 | #325 | Tragic 14.2% |
| Soviet Union | 0.0 /100 | #326 | Tragic 14.2% |
| Ecuadorians | 0.0 /100 | #327 | Tragic 14.1% |
| Immigrants | Albania | 0.0 /100 | #328 | Tragic 14.0% |
| Immigrants | Senegal | 0.0 /100 | #329 | Tragic 13.8% |
| West Indians | 0.0 /100 | #330 | Tragic 13.7% |
| Immigrants | Dominica | 0.0 /100 | #331 | Tragic 13.7% |
| Trinidadians and Tobagonians | 0.0 /100 | #332 | Tragic 13.6% |
| Immigrants | Cabo Verde | 0.0 /100 | #333 | Tragic 13.6% |
| Immigrants | Ecuador | 0.0 /100 | #334 | Tragic 13.4% |
| Immigrants | Trinidad and Tobago | 0.0 /100 | #335 | Tragic 13.3% |
Demographics Similar to Immigrants from Romania by 3 or more Vehicles in Household
In terms of 3 or more vehicles in household, the demographic groups most similar to Immigrants from Romania are Tohono O'odham (18.9%, a difference of 0.030%), Russian (18.8%, a difference of 0.070%), Immigrants from Eastern Asia (18.8%, a difference of 0.080%), Immigrants from Austria (18.9%, a difference of 0.12%), and Immigrants from Chile (18.8%, a difference of 0.16%).
| Demographics | Rating | Rank | 3 or more Vehicles in Household |
| Immigrants | Japan | 22.0 /100 | #197 | Fair 19.0% |
| Egyptians | 19.5 /100 | #198 | Poor 19.0% |
| Immigrants | Norway | 19.0 /100 | #199 | Poor 19.0% |
| Argentineans | 18.2 /100 | #200 | Poor 18.9% |
| Arabs | 17.7 /100 | #201 | Poor 18.9% |
| Immigrants | Austria | 15.4 /100 | #202 | Poor 18.9% |
| Tohono O'odham | 14.8 /100 | #203 | Poor 18.9% |
| Immigrants | Romania | 14.6 /100 | #204 | Poor 18.9% |
| Russians | 14.2 /100 | #205 | Poor 18.8% |
| Immigrants | Eastern Asia | 14.1 /100 | #206 | Poor 18.8% |
| Immigrants | Chile | 13.6 /100 | #207 | Poor 18.8% |
| Immigrants | Burma/Myanmar | 13.6 /100 | #208 | Poor 18.8% |
| Immigrants | Egypt | 13.5 /100 | #209 | Poor 18.8% |
| Bulgarians | 13.1 /100 | #210 | Poor 18.8% |
| Immigrants | Kenya | 12.4 /100 | #211 | Poor 18.8% |