Austrian vs Immigrants from Denmark 3 or more Vehicles in Household
COMPARE
Austrian
Immigrants from Denmark
3 or more Vehicles in Household
3 or more Vehicles in Household Comparison
Austrians
Immigrants from Denmark
20.9%
3 OR MORE VEHICLES IN HOUSEHOLD
97.5/ 100
METRIC RATING
105th/ 347
METRIC RANK
19.6%
3 OR MORE VEHICLES IN HOUSEHOLD
57.6/ 100
METRIC RATING
169th/ 347
METRIC RANK
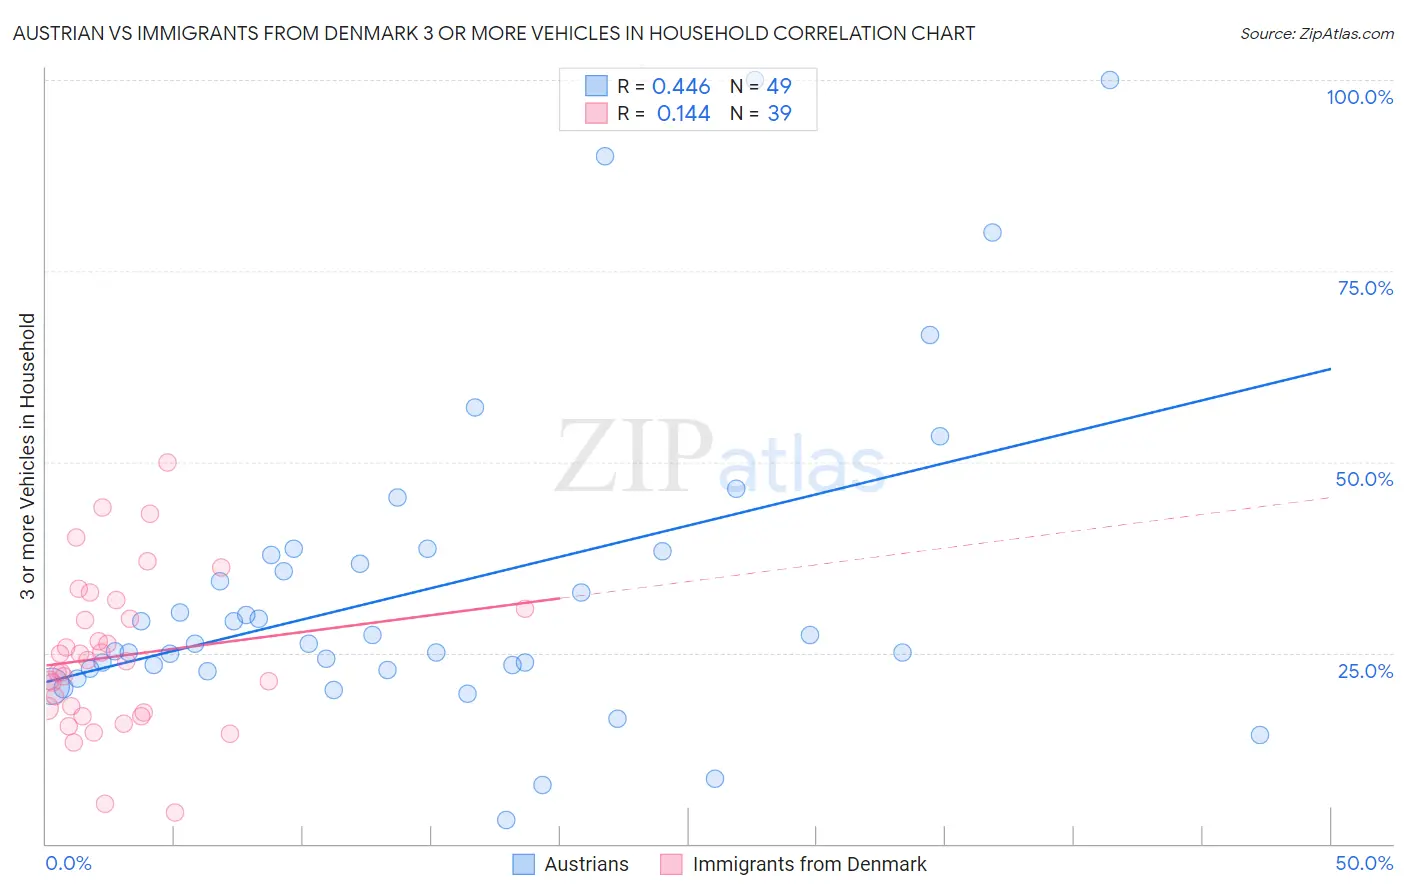
Austrian vs Immigrants from Denmark 3 or more Vehicles in Household Correlation Chart
The statistical analysis conducted on geographies consisting of 451,648,303 people shows a moderate positive correlation between the proportion of Austrians and percentage of households with 3 or more vehicles available in the United States with a correlation coefficient (R) of 0.446 and weighted average of 20.9%. Similarly, the statistical analysis conducted on geographies consisting of 136,395,357 people shows a poor positive correlation between the proportion of Immigrants from Denmark and percentage of households with 3 or more vehicles available in the United States with a correlation coefficient (R) of 0.144 and weighted average of 19.6%, a difference of 6.3%.
3 or more Vehicles in Household Correlation Summary
| Measurement | Austrian | Immigrants from Denmark |
| Minimum | 3.1% | 4.2% |
| Maximum | 100.0% | 49.9% |
| Range | 96.9% | 45.7% |
| Mean | 33.7% | 24.6% |
| Median | 26.2% | 23.8% |
| Interquartile 25% (IQ1) | 22.8% | 17.2% |
| Interquartile 75% (IQ3) | 38.0% | 30.8% |
| Interquartile Range (IQR) | 15.2% | 13.5% |
| Standard Deviation (Sample) | 21.3% | 10.0% |
| Standard Deviation (Population) | 21.1% | 9.9% |
Similar Demographics by 3 or more Vehicles in Household
Demographics Similar to Austrians by 3 or more Vehicles in Household
In terms of 3 or more vehicles in household, the demographic groups most similar to Austrians are Bolivian (20.8%, a difference of 0.090%), Luxembourger (20.9%, a difference of 0.10%), Immigrants from Germany (20.8%, a difference of 0.13%), Dutch West Indian (20.9%, a difference of 0.19%), and Seminole (20.9%, a difference of 0.23%).
| Demographics | Rating | Rank | 3 or more Vehicles in Household |
| Hmong | 98.2 /100 | #98 | Exceptional 21.0% |
| Alaska Natives | 98.2 /100 | #99 | Exceptional 21.0% |
| Comanche | 98.2 /100 | #100 | Exceptional 21.0% |
| Blackfeet | 97.9 /100 | #101 | Exceptional 20.9% |
| Seminole | 97.8 /100 | #102 | Exceptional 20.9% |
| Dutch West Indians | 97.8 /100 | #103 | Exceptional 20.9% |
| Luxembourgers | 97.7 /100 | #104 | Exceptional 20.9% |
| Austrians | 97.5 /100 | #105 | Exceptional 20.9% |
| Bolivians | 97.4 /100 | #106 | Exceptional 20.8% |
| Immigrants | Germany | 97.4 /100 | #107 | Exceptional 20.8% |
| Immigrants | Scotland | 97.1 /100 | #108 | Exceptional 20.8% |
| Filipinos | 97.0 /100 | #109 | Exceptional 20.8% |
| Asians | 96.8 /100 | #110 | Exceptional 20.8% |
| Immigrants | Micronesia | 96.7 /100 | #111 | Exceptional 20.7% |
| Nicaraguans | 96.2 /100 | #112 | Exceptional 20.7% |
Demographics Similar to Immigrants from Denmark by 3 or more Vehicles in Household
In terms of 3 or more vehicles in household, the demographic groups most similar to Immigrants from Denmark are Peruvian (19.6%, a difference of 0.090%), Ukrainian (19.6%, a difference of 0.10%), Iraqi (19.6%, a difference of 0.13%), Immigrants from Cameroon (19.7%, a difference of 0.25%), and Immigrants from Costa Rica (19.7%, a difference of 0.33%).
| Demographics | Rating | Rank | 3 or more Vehicles in Household |
| Estonians | 63.2 /100 | #162 | Good 19.7% |
| Chileans | 63.0 /100 | #163 | Good 19.7% |
| Yugoslavians | 62.9 /100 | #164 | Good 19.7% |
| Immigrants | Costa Rica | 61.9 /100 | #165 | Good 19.7% |
| Immigrants | Cameroon | 60.9 /100 | #166 | Good 19.7% |
| Ukrainians | 58.9 /100 | #167 | Average 19.6% |
| Peruvians | 58.8 /100 | #168 | Average 19.6% |
| Immigrants | Denmark | 57.6 /100 | #169 | Average 19.6% |
| Iraqis | 56.0 /100 | #170 | Average 19.6% |
| Immigrants | Western Europe | 53.2 /100 | #171 | Average 19.5% |
| Kiowa | 50.9 /100 | #172 | Average 19.5% |
| Immigrants | Northern Europe | 50.2 /100 | #173 | Average 19.5% |
| Immigrants | South Africa | 50.0 /100 | #174 | Average 19.5% |
| Syrians | 47.0 /100 | #175 | Average 19.5% |
| Iroquois | 46.0 /100 | #176 | Average 19.4% |