Immigrants from Ukraine vs Immigrants from Romania 3 or more Vehicles in Household
COMPARE
Immigrants from Ukraine
Immigrants from Romania
3 or more Vehicles in Household
3 or more Vehicles in Household Comparison
Immigrants from Ukraine
Immigrants from Romania
17.5%
3 OR MORE VEHICLES IN HOUSEHOLD
0.4/ 100
METRIC RATING
275th/ 347
METRIC RANK
18.9%
3 OR MORE VEHICLES IN HOUSEHOLD
14.6/ 100
METRIC RATING
204th/ 347
METRIC RANK
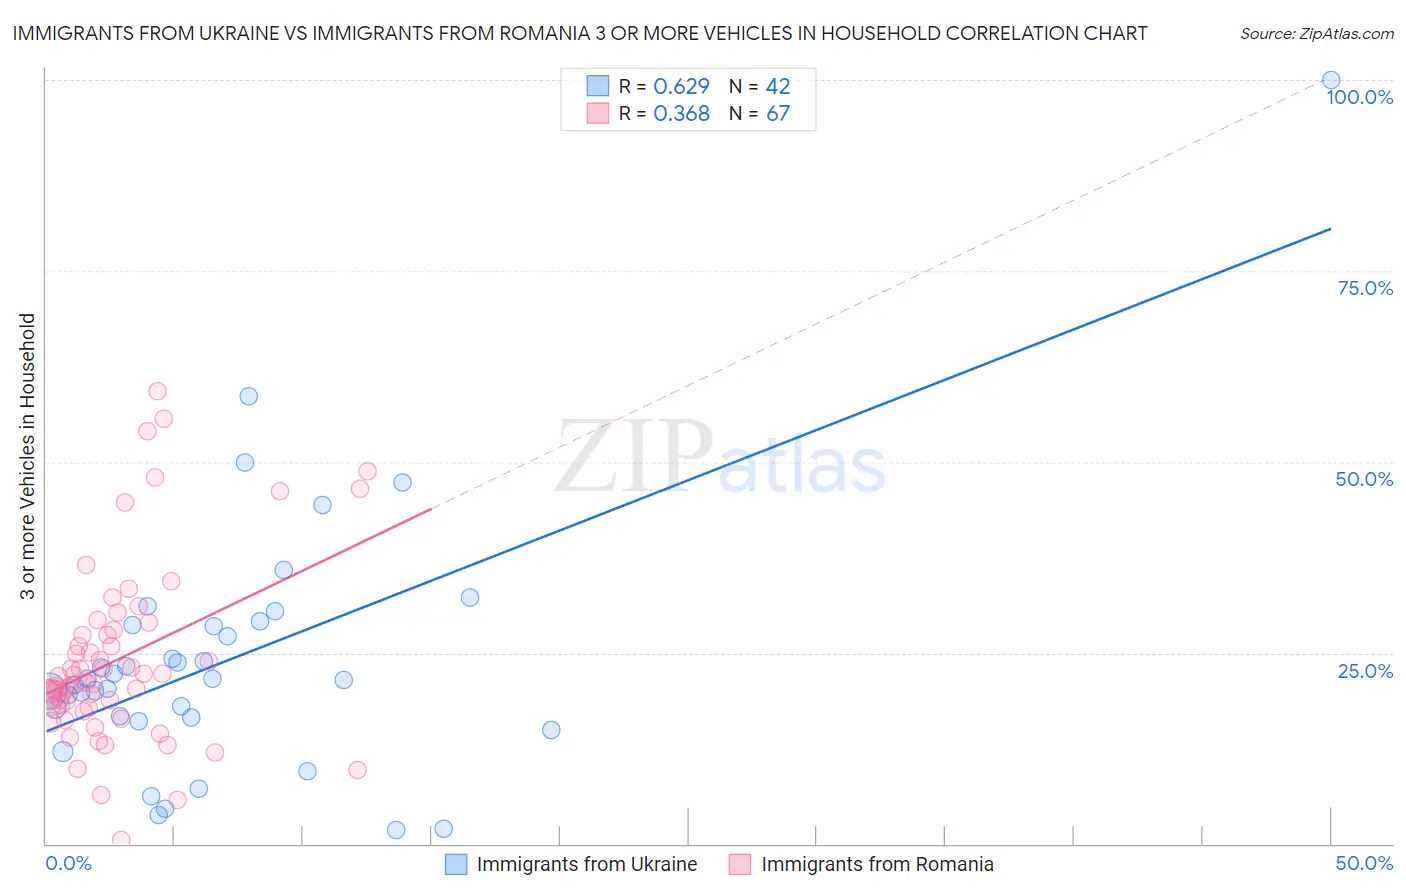
Immigrants from Ukraine vs Immigrants from Romania 3 or more Vehicles in Household Correlation Chart
The statistical analysis conducted on geographies consisting of 289,525,273 people shows a significant positive correlation between the proportion of Immigrants from Ukraine and percentage of households with 3 or more vehicles available in the United States with a correlation coefficient (R) of 0.629 and weighted average of 17.5%. Similarly, the statistical analysis conducted on geographies consisting of 256,899,833 people shows a mild positive correlation between the proportion of Immigrants from Romania and percentage of households with 3 or more vehicles available in the United States with a correlation coefficient (R) of 0.368 and weighted average of 18.9%, a difference of 7.9%.
3 or more Vehicles in Household Correlation Summary
| Measurement | Immigrants from Ukraine | Immigrants from Romania |
| Minimum | 1.8% | 0.43% |
| Maximum | 100.0% | 59.2% |
| Range | 98.2% | 58.8% |
| Mean | 24.2% | 24.2% |
| Median | 21.5% | 21.0% |
| Interquartile 25% (IQ1) | 16.6% | 17.8% |
| Interquartile 75% (IQ3) | 28.7% | 28.0% |
| Interquartile Range (IQR) | 12.1% | 10.2% |
| Standard Deviation (Sample) | 17.2% | 11.9% |
| Standard Deviation (Population) | 17.0% | 11.8% |
Similar Demographics by 3 or more Vehicles in Household
Demographics Similar to Immigrants from Ukraine by 3 or more Vehicles in Household
In terms of 3 or more vehicles in household, the demographic groups most similar to Immigrants from Ukraine are Okinawan (17.4%, a difference of 0.16%), Immigrants from Bosnia and Herzegovina (17.5%, a difference of 0.29%), Brazilian (17.4%, a difference of 0.30%), Immigrants from Bahamas (17.4%, a difference of 0.39%), and Immigrants from Kazakhstan (17.4%, a difference of 0.41%).
| Demographics | Rating | Rank | 3 or more Vehicles in Household |
| Immigrants | Bulgaria | 0.8 /100 | #268 | Tragic 17.7% |
| Immigrants | France | 0.6 /100 | #269 | Tragic 17.6% |
| Immigrants | Nepal | 0.6 /100 | #270 | Tragic 17.6% |
| South Americans | 0.6 /100 | #271 | Tragic 17.6% |
| Immigrants | Africa | 0.5 /100 | #272 | Tragic 17.6% |
| Immigrants | Sudan | 0.5 /100 | #273 | Tragic 17.6% |
| Immigrants | Bosnia and Herzegovina | 0.5 /100 | #274 | Tragic 17.5% |
| Immigrants | Ukraine | 0.4 /100 | #275 | Tragic 17.5% |
| Okinawans | 0.4 /100 | #276 | Tragic 17.4% |
| Brazilians | 0.4 /100 | #277 | Tragic 17.4% |
| Immigrants | Bahamas | 0.3 /100 | #278 | Tragic 17.4% |
| Immigrants | Kazakhstan | 0.3 /100 | #279 | Tragic 17.4% |
| Immigrants | Eastern Europe | 0.3 /100 | #280 | Tragic 17.4% |
| Immigrants | Latvia | 0.3 /100 | #281 | Tragic 17.4% |
| Immigrants | Ireland | 0.3 /100 | #282 | Tragic 17.3% |
Demographics Similar to Immigrants from Romania by 3 or more Vehicles in Household
In terms of 3 or more vehicles in household, the demographic groups most similar to Immigrants from Romania are Tohono O'odham (18.9%, a difference of 0.030%), Russian (18.8%, a difference of 0.070%), Immigrants from Eastern Asia (18.8%, a difference of 0.080%), Immigrants from Austria (18.9%, a difference of 0.12%), and Immigrants from Chile (18.8%, a difference of 0.16%).
| Demographics | Rating | Rank | 3 or more Vehicles in Household |
| Immigrants | Japan | 22.0 /100 | #197 | Fair 19.0% |
| Egyptians | 19.5 /100 | #198 | Poor 19.0% |
| Immigrants | Norway | 19.0 /100 | #199 | Poor 19.0% |
| Argentineans | 18.2 /100 | #200 | Poor 18.9% |
| Arabs | 17.7 /100 | #201 | Poor 18.9% |
| Immigrants | Austria | 15.4 /100 | #202 | Poor 18.9% |
| Tohono O'odham | 14.8 /100 | #203 | Poor 18.9% |
| Immigrants | Romania | 14.6 /100 | #204 | Poor 18.9% |
| Russians | 14.2 /100 | #205 | Poor 18.8% |
| Immigrants | Eastern Asia | 14.1 /100 | #206 | Poor 18.8% |
| Immigrants | Chile | 13.6 /100 | #207 | Poor 18.8% |
| Immigrants | Burma/Myanmar | 13.6 /100 | #208 | Poor 18.8% |
| Immigrants | Egypt | 13.5 /100 | #209 | Poor 18.8% |
| Bulgarians | 13.1 /100 | #210 | Poor 18.8% |
| Immigrants | Kenya | 12.4 /100 | #211 | Poor 18.8% |