Austrian vs Immigrants from Denmark College, 1 year or more
COMPARE
Austrian
Immigrants from Denmark
College, 1 year or more
College, 1 year or more Comparison
Austrians
Immigrants from Denmark
61.8%
COLLEGE, 1 YEAR OR MORE
95.4/ 100
METRIC RATING
112th/ 347
METRIC RANK
65.6%
COLLEGE, 1 YEAR OR MORE
100.0/ 100
METRIC RATING
30th/ 347
METRIC RANK
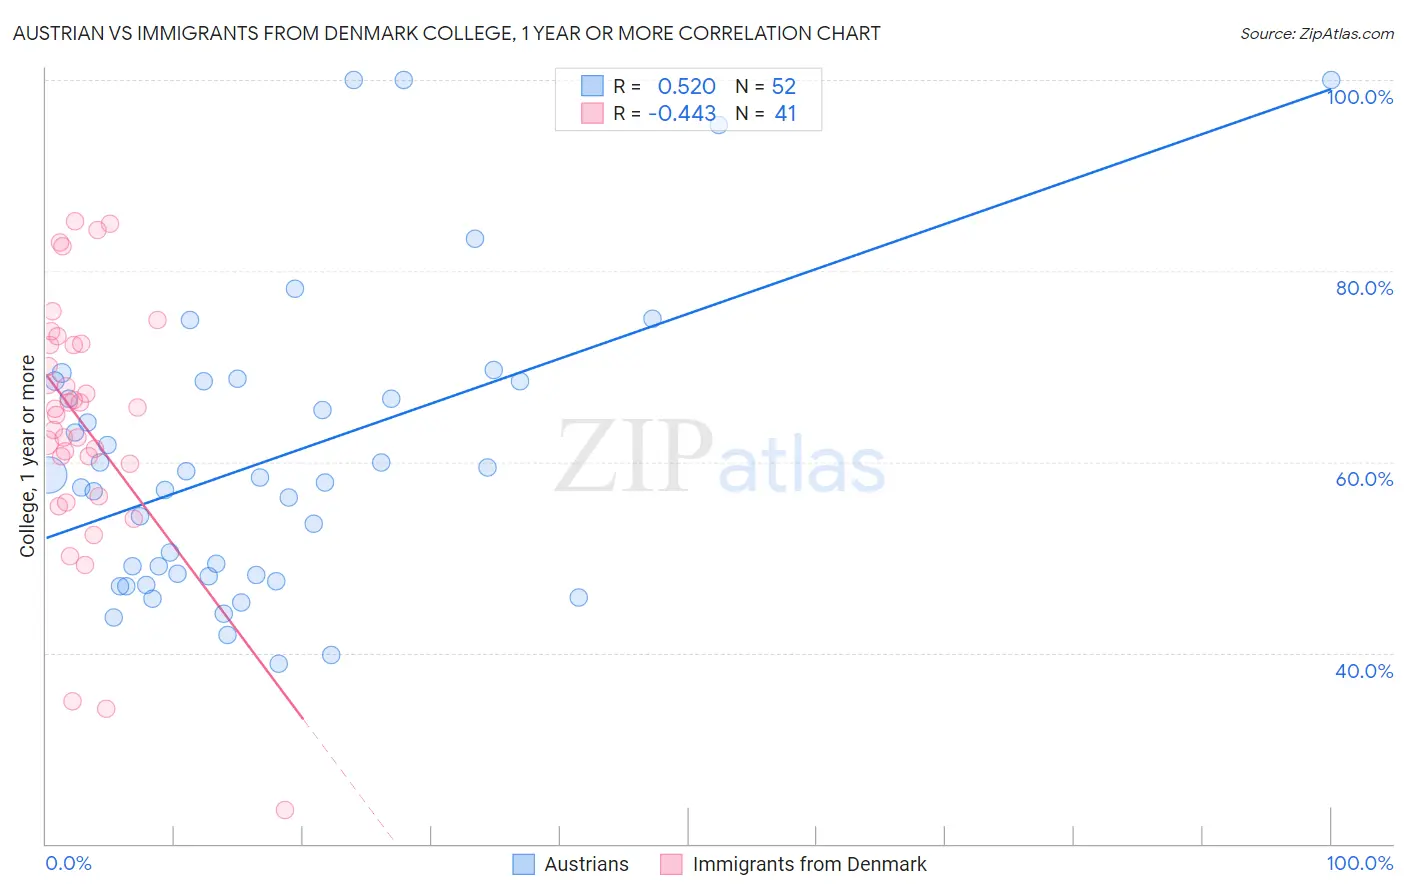
Austrian vs Immigrants from Denmark College, 1 year or more Correlation Chart
The statistical analysis conducted on geographies consisting of 452,079,126 people shows a substantial positive correlation between the proportion of Austrians and percentage of population with at least college, 1 year or more education in the United States with a correlation coefficient (R) of 0.520 and weighted average of 61.8%. Similarly, the statistical analysis conducted on geographies consisting of 136,430,932 people shows a moderate negative correlation between the proportion of Immigrants from Denmark and percentage of population with at least college, 1 year or more education in the United States with a correlation coefficient (R) of -0.443 and weighted average of 65.6%, a difference of 6.1%.
College, 1 year or more Correlation Summary
| Measurement | Austrian | Immigrants from Denmark |
| Minimum | 38.8% | 23.5% |
| Maximum | 100.0% | 85.2% |
| Range | 61.2% | 61.6% |
| Mean | 60.2% | 64.0% |
| Median | 58.1% | 65.5% |
| Interquartile 25% (IQ1) | 48.1% | 58.1% |
| Interquartile 75% (IQ3) | 68.4% | 72.3% |
| Interquartile Range (IQR) | 20.3% | 14.1% |
| Standard Deviation (Sample) | 15.3% | 13.3% |
| Standard Deviation (Population) | 15.2% | 13.1% |
Similar Demographics by College, 1 year or more
Demographics Similar to Austrians by College, 1 year or more
In terms of college, 1 year or more, the demographic groups most similar to Austrians are European (61.8%, a difference of 0.060%), Macedonian (61.8%, a difference of 0.060%), Ukrainian (61.8%, a difference of 0.070%), Syrian (61.9%, a difference of 0.080%), and Immigrants from Northern Africa (61.9%, a difference of 0.080%).
| Demographics | Rating | Rank | College, 1 year or more |
| Immigrants | Nepal | 96.3 /100 | #105 | Exceptional 62.0% |
| Palestinians | 96.3 /100 | #106 | Exceptional 62.0% |
| Immigrants | Ukraine | 95.8 /100 | #107 | Exceptional 61.9% |
| Syrians | 95.7 /100 | #108 | Exceptional 61.9% |
| Immigrants | Northern Africa | 95.7 /100 | #109 | Exceptional 61.9% |
| Europeans | 95.6 /100 | #110 | Exceptional 61.8% |
| Macedonians | 95.6 /100 | #111 | Exceptional 61.8% |
| Austrians | 95.4 /100 | #112 | Exceptional 61.8% |
| Ukrainians | 95.2 /100 | #113 | Exceptional 61.8% |
| Danes | 94.8 /100 | #114 | Exceptional 61.7% |
| Norwegians | 94.5 /100 | #115 | Exceptional 61.7% |
| Lebanese | 94.1 /100 | #116 | Exceptional 61.6% |
| Arabs | 93.9 /100 | #117 | Exceptional 61.6% |
| Immigrants | Brazil | 93.9 /100 | #118 | Exceptional 61.6% |
| Assyrians/Chaldeans/Syriacs | 93.3 /100 | #119 | Exceptional 61.5% |
Demographics Similar to Immigrants from Denmark by College, 1 year or more
In terms of college, 1 year or more, the demographic groups most similar to Immigrants from Denmark are Turkish (65.5%, a difference of 0.080%), Immigrants from Northern Europe (65.6%, a difference of 0.11%), Bulgarian (65.5%, a difference of 0.13%), Immigrants from Sri Lanka (65.4%, a difference of 0.28%), and Immigrants from France (65.8%, a difference of 0.36%).
| Demographics | Rating | Rank | College, 1 year or more |
| Immigrants | China | 100.0 /100 | #23 | Exceptional 66.4% |
| Immigrants | Belgium | 100.0 /100 | #24 | Exceptional 66.3% |
| Indians (Asian) | 100.0 /100 | #25 | Exceptional 66.1% |
| Latvians | 100.0 /100 | #26 | Exceptional 66.1% |
| Immigrants | Ireland | 100.0 /100 | #27 | Exceptional 65.9% |
| Immigrants | France | 100.0 /100 | #28 | Exceptional 65.8% |
| Immigrants | Northern Europe | 100.0 /100 | #29 | Exceptional 65.6% |
| Immigrants | Denmark | 100.0 /100 | #30 | Exceptional 65.6% |
| Turks | 100.0 /100 | #31 | Exceptional 65.5% |
| Bulgarians | 100.0 /100 | #32 | Exceptional 65.5% |
| Immigrants | Sri Lanka | 99.9 /100 | #33 | Exceptional 65.4% |
| Israelis | 99.9 /100 | #34 | Exceptional 65.3% |
| Immigrants | Turkey | 99.9 /100 | #35 | Exceptional 65.2% |
| Immigrants | South Africa | 99.9 /100 | #36 | Exceptional 65.1% |
| Russians | 99.9 /100 | #37 | Exceptional 65.1% |