Puerto Rican vs Immigrants from Denmark 3 or more Vehicles in Household
COMPARE
Puerto Rican
Immigrants from Denmark
3 or more Vehicles in Household
3 or more Vehicles in Household Comparison
Puerto Ricans
Immigrants from Denmark
15.6%
3 OR MORE VEHICLES IN HOUSEHOLD
0.0/ 100
METRIC RATING
312th/ 347
METRIC RANK
19.6%
3 OR MORE VEHICLES IN HOUSEHOLD
57.6/ 100
METRIC RATING
169th/ 347
METRIC RANK
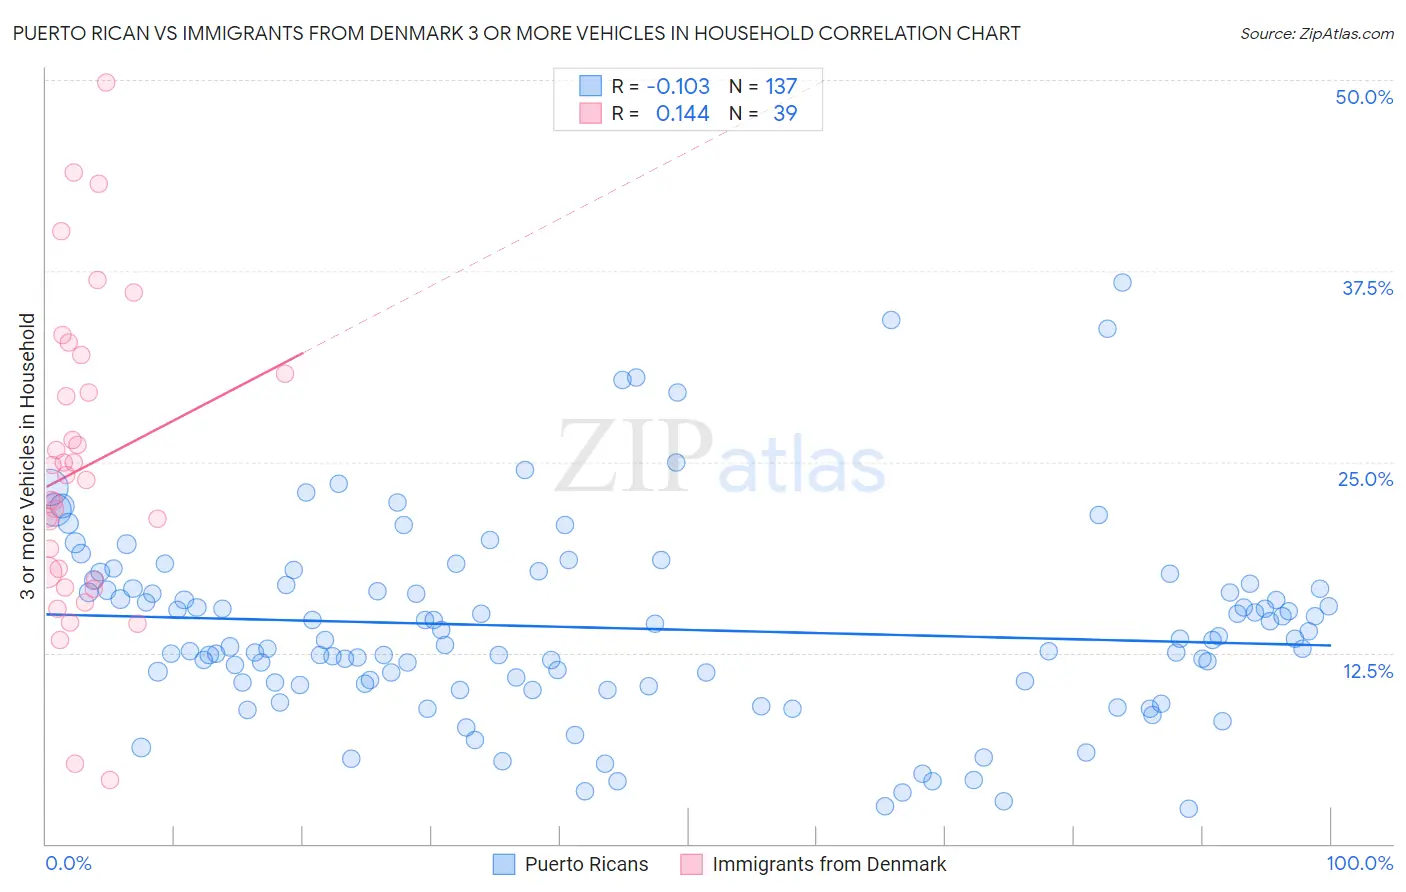
Puerto Rican vs Immigrants from Denmark 3 or more Vehicles in Household Correlation Chart
The statistical analysis conducted on geographies consisting of 527,466,377 people shows a poor negative correlation between the proportion of Puerto Ricans and percentage of households with 3 or more vehicles available in the United States with a correlation coefficient (R) of -0.103 and weighted average of 15.6%. Similarly, the statistical analysis conducted on geographies consisting of 136,395,357 people shows a poor positive correlation between the proportion of Immigrants from Denmark and percentage of households with 3 or more vehicles available in the United States with a correlation coefficient (R) of 0.144 and weighted average of 19.6%, a difference of 25.5%.
3 or more Vehicles in Household Correlation Summary
| Measurement | Puerto Rican | Immigrants from Denmark |
| Minimum | 2.3% | 4.2% |
| Maximum | 36.7% | 49.9% |
| Range | 34.5% | 45.7% |
| Mean | 14.1% | 24.6% |
| Median | 13.4% | 23.8% |
| Interquartile 25% (IQ1) | 10.5% | 17.2% |
| Interquartile 75% (IQ3) | 16.8% | 30.8% |
| Interquartile Range (IQR) | 6.4% | 13.5% |
| Standard Deviation (Sample) | 6.3% | 10.0% |
| Standard Deviation (Population) | 6.3% | 9.9% |
Similar Demographics by 3 or more Vehicles in Household
Demographics Similar to Puerto Ricans by 3 or more Vehicles in Household
In terms of 3 or more vehicles in household, the demographic groups most similar to Puerto Ricans are Immigrants from Israel (15.6%, a difference of 0.020%), Immigrants from Belarus (15.5%, a difference of 0.66%), Haitian (15.5%, a difference of 0.98%), Albanian (15.8%, a difference of 1.1%), and U.S. Virgin Islander (15.4%, a difference of 1.5%).
| Demographics | Rating | Rank | 3 or more Vehicles in Household |
| Immigrants | Morocco | 0.0 /100 | #305 | Tragic 16.3% |
| Somalis | 0.0 /100 | #306 | Tragic 16.2% |
| Immigrants | Ghana | 0.0 /100 | #307 | Tragic 16.2% |
| Houma | 0.0 /100 | #308 | Tragic 16.1% |
| Immigrants | Somalia | 0.0 /100 | #309 | Tragic 15.9% |
| Moroccans | 0.0 /100 | #310 | Tragic 15.9% |
| Albanians | 0.0 /100 | #311 | Tragic 15.8% |
| Puerto Ricans | 0.0 /100 | #312 | Tragic 15.6% |
| Immigrants | Israel | 0.0 /100 | #313 | Tragic 15.6% |
| Immigrants | Belarus | 0.0 /100 | #314 | Tragic 15.5% |
| Haitians | 0.0 /100 | #315 | Tragic 15.5% |
| U.S. Virgin Islanders | 0.0 /100 | #316 | Tragic 15.4% |
| Jamaicans | 0.0 /100 | #317 | Tragic 15.2% |
| Immigrants | Haiti | 0.0 /100 | #318 | Tragic 15.2% |
| Cape Verdeans | 0.0 /100 | #319 | Tragic 15.0% |
Demographics Similar to Immigrants from Denmark by 3 or more Vehicles in Household
In terms of 3 or more vehicles in household, the demographic groups most similar to Immigrants from Denmark are Peruvian (19.6%, a difference of 0.090%), Ukrainian (19.6%, a difference of 0.10%), Iraqi (19.6%, a difference of 0.13%), Immigrants from Cameroon (19.7%, a difference of 0.25%), and Immigrants from Costa Rica (19.7%, a difference of 0.33%).
| Demographics | Rating | Rank | 3 or more Vehicles in Household |
| Estonians | 63.2 /100 | #162 | Good 19.7% |
| Chileans | 63.0 /100 | #163 | Good 19.7% |
| Yugoslavians | 62.9 /100 | #164 | Good 19.7% |
| Immigrants | Costa Rica | 61.9 /100 | #165 | Good 19.7% |
| Immigrants | Cameroon | 60.9 /100 | #166 | Good 19.7% |
| Ukrainians | 58.9 /100 | #167 | Average 19.6% |
| Peruvians | 58.8 /100 | #168 | Average 19.6% |
| Immigrants | Denmark | 57.6 /100 | #169 | Average 19.6% |
| Iraqis | 56.0 /100 | #170 | Average 19.6% |
| Immigrants | Western Europe | 53.2 /100 | #171 | Average 19.5% |
| Kiowa | 50.9 /100 | #172 | Average 19.5% |
| Immigrants | Northern Europe | 50.2 /100 | #173 | Average 19.5% |
| Immigrants | South Africa | 50.0 /100 | #174 | Average 19.5% |
| Syrians | 47.0 /100 | #175 | Average 19.5% |
| Iroquois | 46.0 /100 | #176 | Average 19.4% |