Austrian vs Immigrants from Denmark Median Male Earnings
COMPARE
Austrian
Immigrants from Denmark
Median Male Earnings
Median Male Earnings Comparison
Austrians
Immigrants from Denmark
$59,359
MEDIAN MALE EARNINGS
99.2/ 100
METRIC RATING
90th/ 347
METRIC RANK
$64,625
MEDIAN MALE EARNINGS
100.0/ 100
METRIC RATING
25th/ 347
METRIC RANK
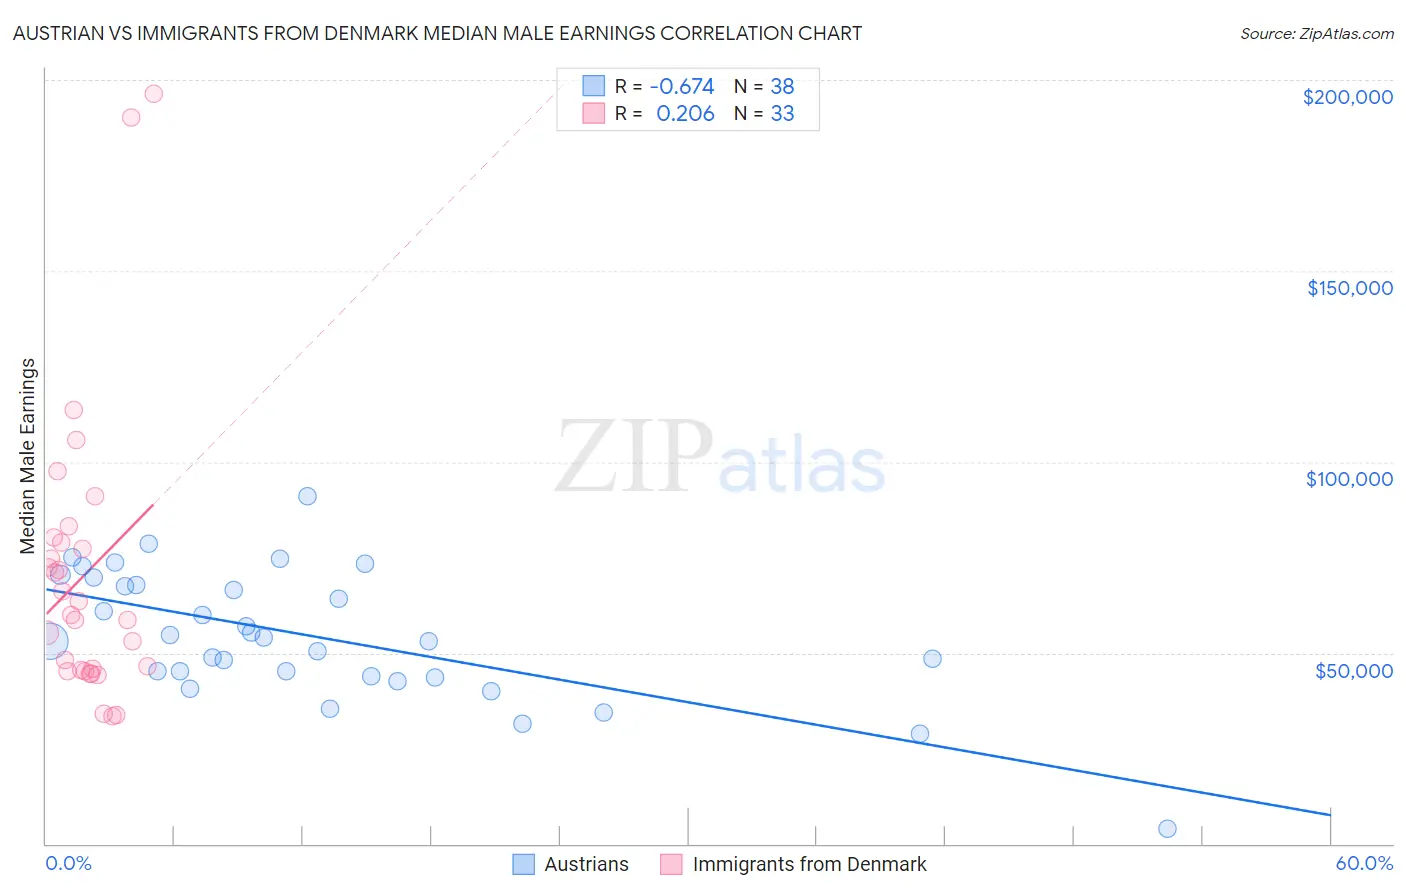
Austrian vs Immigrants from Denmark Median Male Earnings Correlation Chart
The statistical analysis conducted on geographies consisting of 451,854,520 people shows a significant negative correlation between the proportion of Austrians and median male earnings in the United States with a correlation coefficient (R) of -0.674 and weighted average of $59,359. Similarly, the statistical analysis conducted on geographies consisting of 136,409,110 people shows a weak positive correlation between the proportion of Immigrants from Denmark and median male earnings in the United States with a correlation coefficient (R) of 0.206 and weighted average of $64,625, a difference of 8.9%.
Median Male Earnings Correlation Summary
| Measurement | Austrian | Immigrants from Denmark |
| Minimum | $3,902 | $33,446 |
| Maximum | $91,143 | $196,250 |
| Range | $87,241 | $162,804 |
| Mean | $54,430 | $70,566 |
| Median | $53,632 | $59,978 |
| Interquartile 25% (IQ1) | $43,967 | $45,341 |
| Interquartile 75% (IQ3) | $67,629 | $79,588 |
| Interquartile Range (IQR) | $23,662 | $34,248 |
| Standard Deviation (Sample) | $16,958 | $37,718 |
| Standard Deviation (Population) | $16,734 | $37,142 |
Similar Demographics by Median Male Earnings
Demographics Similar to Austrians by Median Male Earnings
In terms of median male earnings, the demographic groups most similar to Austrians are Laotian ($59,351, a difference of 0.010%), Immigrants from Moldova ($59,417, a difference of 0.10%), Immigrants from Kazakhstan ($59,278, a difference of 0.14%), Immigrants from Argentina ($59,491, a difference of 0.22%), and Immigrants from Southern Europe ($59,217, a difference of 0.24%).
| Demographics | Rating | Rank | Median Male Earnings |
| Immigrants | Italy | 99.4 /100 | #83 | Exceptional $59,691 |
| Afghans | 99.3 /100 | #84 | Exceptional $59,554 |
| Italians | 99.3 /100 | #85 | Exceptional $59,551 |
| Immigrants | England | 99.3 /100 | #86 | Exceptional $59,527 |
| Macedonians | 99.3 /100 | #87 | Exceptional $59,522 |
| Immigrants | Argentina | 99.3 /100 | #88 | Exceptional $59,491 |
| Immigrants | Moldova | 99.2 /100 | #89 | Exceptional $59,417 |
| Austrians | 99.2 /100 | #90 | Exceptional $59,359 |
| Laotians | 99.2 /100 | #91 | Exceptional $59,351 |
| Immigrants | Kazakhstan | 99.1 /100 | #92 | Exceptional $59,278 |
| Immigrants | Southern Europe | 99.0 /100 | #93 | Exceptional $59,217 |
| Immigrants | North Macedonia | 99.0 /100 | #94 | Exceptional $59,189 |
| Immigrants | Lebanon | 98.6 /100 | #95 | Exceptional $58,835 |
| Albanians | 98.4 /100 | #96 | Exceptional $58,680 |
| Northern Europeans | 98.2 /100 | #97 | Exceptional $58,588 |
Demographics Similar to Immigrants from Denmark by Median Male Earnings
In terms of median male earnings, the demographic groups most similar to Immigrants from Denmark are Immigrants from Northern Europe ($64,987, a difference of 0.56%), Turkish ($64,253, a difference of 0.58%), Immigrants from Korea ($65,079, a difference of 0.70%), Burmese ($65,236, a difference of 0.95%), and Immigrants from Switzerland ($63,944, a difference of 1.1%).
| Demographics | Rating | Rank | Median Male Earnings |
| Indians (Asian) | 100.0 /100 | #18 | Exceptional $66,078 |
| Cypriots | 100.0 /100 | #19 | Exceptional $65,549 |
| Immigrants | Japan | 100.0 /100 | #20 | Exceptional $65,518 |
| Immigrants | Sweden | 100.0 /100 | #21 | Exceptional $65,406 |
| Burmese | 100.0 /100 | #22 | Exceptional $65,236 |
| Immigrants | Korea | 100.0 /100 | #23 | Exceptional $65,079 |
| Immigrants | Northern Europe | 100.0 /100 | #24 | Exceptional $64,987 |
| Immigrants | Denmark | 100.0 /100 | #25 | Exceptional $64,625 |
| Turks | 100.0 /100 | #26 | Exceptional $64,253 |
| Immigrants | Switzerland | 100.0 /100 | #27 | Exceptional $63,944 |
| Russians | 100.0 /100 | #28 | Exceptional $63,939 |
| Asians | 100.0 /100 | #29 | Exceptional $63,827 |
| Immigrants | France | 100.0 /100 | #30 | Exceptional $63,715 |
| Latvians | 100.0 /100 | #31 | Exceptional $63,498 |
| Soviet Union | 100.0 /100 | #32 | Exceptional $63,382 |